Drawing, Adjusting, and Deleting Trend Lines in a Chart Window or Pane
Neovest lets you draw extended, truncated, and Fibonacci trend lines in an open Chart window or Chart pane. Trend lines are designed to be drawn on symbol data within charts to indicate where trends have occurred and where trends are likely to occur again. Thus, trend lines may be used to pinpoint the very best times to trade individual symbols.
Neovest also lets you adjust a drawn extended, truncated, and Fibonacci trend line to the high, low, open, and close prices of Chart data in an open Chart window or Chart pane. Using Neovest's trend line features, you may also reposition either end of a drawn trend line, move an entire drawn trend line, and delete all types of drawn trend lines.
Note: Once you draw a trend line on a particular symbol's data in a Neovest Chart window, you may choose to have Neovest alert you when the price of the symbol crosses your drawn trend line. For more information on this feature, refer to the "Setting Trend Line Alerts" section in the "Alerts" chapter in Neovest's Help documentation.
Drawing a Trend Line
The following instructions explain how you may draw an extended, truncated, or Fibonacci trend line in an open Neovest Chart window or Chart pane:
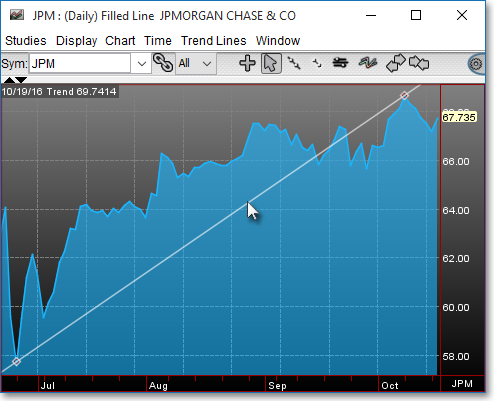
Click the "Draw an Extended Trend Line," "Draw a Truncated Trend Line," or "Draw a Fibonacci Trend Line" icon on an open Chart window's toolbar.

Click and hold with the left mouse button at the point in the Chart window or Chart pane where you wish to begin the extended, truncated, or Fibonacci trend line; drag the cursor to where you wish to end the trend line; and release the left mouse button.

Adjusting a Trend Line
Neovest lets you adjust a drawn extended, truncated, and Fibonacci trend line to the high, low, open, and close prices of the Chart data in an open Chart window or Chart pane. Neovest also lets you click on different parts of a drawn trend line to reposition either end of the trend line or move the entire trend line.
The following instructions explain how you may adjust a drawn trend line to various prices in an open Chart window or Chart pane:
Click the "Select a Trend Line for Editing" arrow cursor icon on an open Chart window's toolbar.

Click on the straight line between the two diamonds of the drawn trend line you wish to adjust.
Note: If you wish to adjust a drawn Fibonacci trend line, you must click on the imaginary straight line between the two Fibonacci diamonds for this feature to function properly.
Once the drawn trend line is selected, click on the Trend Lines menu near the top of the open Chart window.
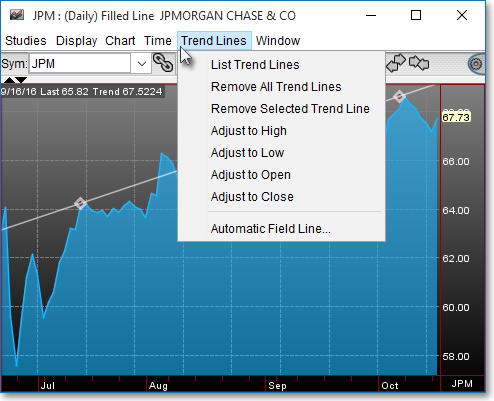
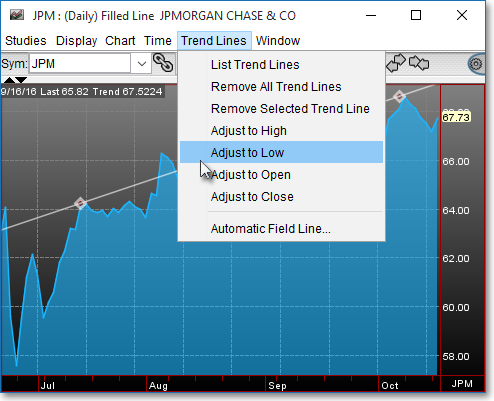
Once the menu appears, select Adjust to High, Adjust to Low, Adjust to Open, or Adjust to Close to adjust the selected extended, truncated, or Fibonacci trend line to the high, low, open, or closed prices respectively of the Chart data.
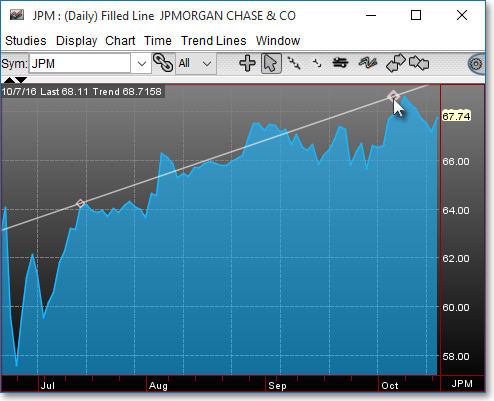
Note: Simply repeat the instructions above to continue to adjust the trend lines to the Chart data prices you wish.
The following instructions explain how you may reposition either end of a drawn trend line in an open Chart window or Chart pane:
Click the "Select a Trend Line for Editing" arrow cursor icon on an open Chart window's toolbar.
Click and hold on the diamond at the end of the drawn trend line that you wish to reposition. Once the diamond is selected, simply reposition the selected end of the trend line to the location you wish in the open Chart window or Chart pane and release the left mouse button.
The following instructions explain how you may move a drawn trend line in an open Chart window or Chart pane:
Click the "Select a Trend Line for Editing" arrow cursor icon on an open Chart window's toolbar.
Click and hold on the straight line between the two diamonds of the drawn trend line you wish to move. Once the drawn trend line is selected, simply move the trend line to the location you wish in the open Chart window or Chart pane and release the left mouse button.
Note: If you wish to move a drawn Fibonacci trend line, you must click on the imaginary straight line between the two Fibonacci diamonds for this feature to function properly.
Deleting All Trend Lines or a Single Selected Trend Line
Neovest lets you delete all of the drawn extended, truncated, and Fibonacci trend lines or a single selected trend line in an open Chart window or Chart pane.
The following instructions explain how you may delete all of the drawn trend lines in an open Chart window:
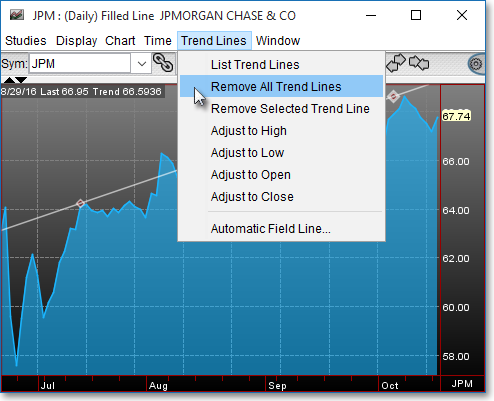
Click the Trend Lines menu near the top of the open Chart window. Once the menu appears, select Remove All Trend Lines to delete all of the drawn trend lines in the open Chart window.
Note: You may also use the hot keys Ctrl+Delete to quickly delete all of the drawn trend lines in an open Chart window.
The following instructions explain how you may delete a single selected drawn trend line in an open Chart window or Chart pane.
Click the "Select a Trend Line for Editing" arrow cursor icon on an open Chart window's toolbar.
Click on the straight line between the two diamonds of the drawn trend line you wish to delete. Once the drawn trend line is selected, simply press the Delete key to delete the selected trend line.

Note: If you wish to delete a drawn Fibonacci trend line, you must click on the imaginary straight line between the two Fibonacci diamonds for this feature to function properly.