Chart Window Toolbar
Near the top of Neovest's Chart window is a horizontal row of icons that is referred to in Neovest as the Chart window toolbar.

Icons in the Chart window toolbar are designed to let you access a Neovest feature or window with a single click and are essentially comprised of three types of charting tools that let you (1) utilize different types of mouse pointers, (2) draw trend lines, and (3) manipulate the symbol data in an open Neovest Chart window.
The following table describes the function of each icon in Neovest's Chart window toolbar but does not explain in detail the features or windows associated with certain icons. As questions arise concerning any of the features or windows discussed in the following table, refer to the "Chart" chapter in Neovest's Help documentation for further assistance.
| Feature: | Description: |
Link/Unlink
Window
 |
Lets you link
or unlink a Chart window to or from other Neovest windows that
are open on your screen. All open Neovest windows that are linked
will load the same symbol; therefore, if you double-click on a symbol
displayed in an open Neovest QuoteWatch window, then a Chart window
will automatically load the same symbol. As you click on the "Link
Window" icon, the image of the link will change to appear either
intact or broken. If the link appears intact, then a Chart window
is linked to other Neovest windows that are open on your screen;
if it appears broken, then it is not linked. Note: For information regarding linking a Chart window to "All" open Neovest windows or to only certain windows that are on the same channel, refer to the proceeding "All" instructions in this table. |
All
 |
Lets you choose
to link a Chart window to "All" open Neovest windows or
to only certain windows that are on the same channel. Neovest provides
20 different channels to which you may link windows. For instance,
you may choose to link two open Neovest windows to channel "1,"
which will cause the two windows and any other windows that are linked
to "All" to automatically load the same symbol. All other
open Neovest windows that are not linked to "All" or to
channel "1" will not load the same symbol.
Note: For information regarding why you may wish to link and unlink a Chart window to and from other Neovest windows that are open on your screen, refer to the preceding "Link/Unlink Window" instructions in this table. |
Status Cursor
 |
Changes the selecting mouse cursor to the status mouse cursor, which lets you click with the left mouse button anywhere in an open Chart window or Chart pane to display timely price and other calculated data relevant to the entered symbol and each loaded technical indicator. |
Selecting Cursor
 |
Changes the status mouse cursor to the selecting mouse cursor, which lets you adjust a drawn extended, truncated, or Fibonacci trend line to the high, low, open, and close prices of Chart data in an open Chart window or Chart pane. Using this feature, you may also reposition either end of a drawn trend line, move an entire drawn trend line, and delete a single drawn trend line. For more information regarding how you may utilize this feature in connection with trend lines in a Chart window, refer to the "Trend Lines" section in the "Chart" chapter in Neovest's Help documentation. |
Extended
Trend Line
 |
Lets you draw an extended trend line in an open Chart window or Chart pane. The process of drawing an extended trend line is simple: Once you have selected this feature, click and hold with the left mouse button at the point in the Chart window or Chart pane where you wish to begin the extended trend line, drag the cursor to where you wish to end the trend line, and release the left mouse button. |
Truncated Trend Line
 |
Lets you draw a truncated trend line in an open Chart window or Chart pane. The process of drawing a truncated trend line is simple: Once you have selected this feature, click and hold with the left mouse button at the point in the Chart window or Chart pane where you wish to begin the truncated trend line, drag the cursor to where you wish to end the trend line, and release the left mouse button. |
Fibonacci
trend Line
 |
Lets you draw a Fibonacci trend line in an open Chart window or Chart pane. The process of drawing a Fibonacci trend line is simple: Once you have selected this feature, click and hold with the left mouse button at the point in the Chart window or Chart pane where you wish to begin the Fibonacci trend line, drag the cursor to where you wish to end the trend line, and release the left mouse button. |
Symbol
Overlay
 |
Lets you add a second symbol to an open Chart window, thus allowing you to compare the current and historical trading activity of two different symbols over the course of the same time period. |
Expand
Chart
 |
Expands the symbol data in an open Chart window by removing symbol data. |
Condense
Chart
 |
Condenses the symbol data in an open Chart window by adding symbol data. |
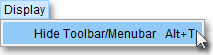
Note: You may remove the toolbar near the top of an open Neovest Chart window by selecting Display | Hide Toolbar. Once the toolbar has been removed, simply select Display | Show Toolbar to restore the toolbar.
Further features may be accessed by clicking the gear icon, located on the far-right of the toolbar.
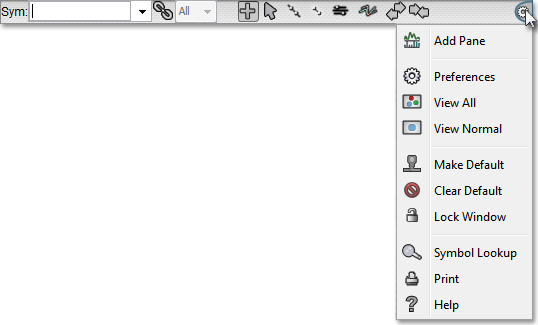
The following table describes the function of each icon in the drop-down menu but does not explain in detail the features or windows associated with certain icons. As questions arise concerning any of the features or windows discussed in the following table, refer to the "Chart" chapter in Neovest's Help documentation for further assistance.
Feature: |
Description: |
Add Pane
 |
Lets you add an additional pane or panes to an open Chart window, which lets you clearly see more than one technical indicator or charting tool applied separately to the same symbol in an open Chart window. For more information on adding and removing panes in an open Chart window, refer to the "Add/Remove Panes" section in the "Chart" chapter in Neovest's Help documentation. |
Preferences
 |
Accesses the "Chart Preferences" box, which lets you (1) specify the time frame of the symbol data and the amount of historical symbol data to be displayed, (2) edit the parameters of a technical indicator that has been loaded in an open Chart window or Chart pane, (3) add and remove major and minor time and price grids, (4) increase and decrease the X and Y axis, and (5) change the colors in a Neovest Chart window. |
View
All
 |
Loads the open Chart window with the number of ticks, intraday periods, days, weeks, or months specified in the "Chart Setup" box. The "Chart Setup" box is accessed by clicking with the right mouse button in the body of an open Chart window and selecting Time Frame from the menu that appears. |
View
Normal
 |
Loads the open Chart window with approximately 80 ticks, intraday periods, days, weeks, or months of symbol data. |
Make Default
 |
Lets you save a Chart window that you have customized as the default Chart window. Once you save a customized Chart window as the default, then each time you click on the "Chart" icon on Neovest's Launch Pad, your saved default Chart window will appear. |
| Clear Default  |
Lets you reset the default Chart window to the original default established by Neovest. |
Lock
Window
 |
Lets you lock a Chart window to remain open in a fixed position on your screen. Once you choose to lock a particular window using this feature, the window will remain open even if you choose to open and close one or more of your layouts. |
Symbol Lookup
 |
Accesses the "Symbol Lookup Guide" box, which lets you search for and view information regarding a particular cash item, equity, future, future spread, or index. Further features in this box let you search by "Description," "Ticker Symbol," "Bloomberg Symbol," or various symbol identification sources such as "RIC," "SEDOL," "ISIN," or "CUSIP." Lastly, Neovest lets you narrow your search results by selecting from a wide array of international exchanges or by entering key words or phrases to limit Neovest's search findings. |
Print
 |
Accesses a window with several printing options that let you print the contents of a Neovest Chart window in various formats. |
Help
 |
Accesses Neovest's Help menu documentation. |