Chart Window Preferences
Features in Neovest's "Chart Preferences" box let you (1) specify the time frame of the symbol data and the amount of historical symbol data to be displayed, (2) edit the parameters of a technical indicator that has been loaded in an open Chart window or Chart pane, (3) add and remove major and minor time and price grids, (4) increase and decrease the X and Y axis, and (5) change the colors in a Neovest Chart window.
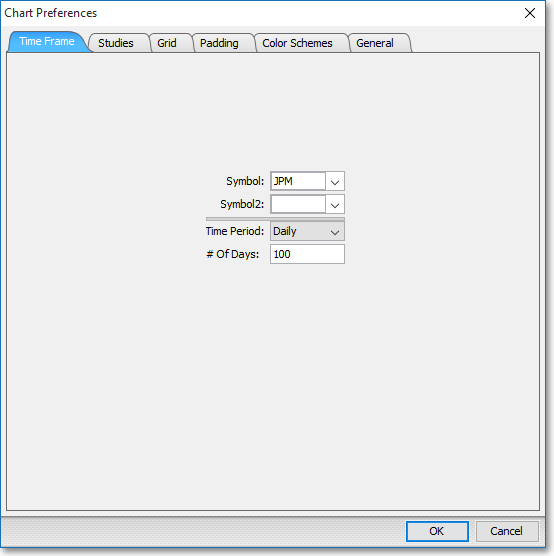
The "Chart Preferences" sections in the menu to the left discuss the five tabs (i.e., "Time Frame," "Studies," "Grid," "Padding," and "Color Schemes") in the "Chart Preferences" box.