Moving Averages
Introduction
Moving Averages show the average value of a symbol's price over a specified interval of time. The most popular Moving Average time period is the 200-day Moving Average.
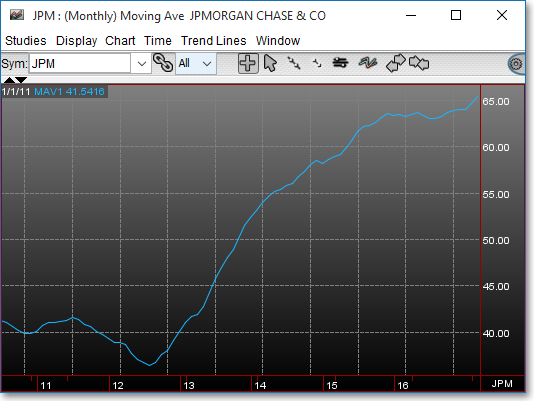
Neovest provides three different variables for its Moving Averages indicators. Definitions of the three different variables are provided below:
1. Single MAV — displays a single moving average line.
MAV Period > > MAV: This parameter lets you enter the Moving Average period and the price information you wish to use. The period is determined by the time interval you are using. For example, if you are using five-minute intervals of data and you enter "3" as the period, each point on the chart will represent the average of three five-minute intervals, totaling 15 minutes. If you are using daily data, each point on the chart will represent the average of three days.
2. Double MAV — displays two moving average lines in one chart window.
1st Period > > MAV1: This parameter lets you enter the Moving Average period and the price information you wish to use. The period is determined by the time interval you are using. For example, if you are using five-minute intervals of data and you enter "3" as the period, each point on the chart will represent the average of three five-minute intervals, totaling 15 minutes. If you are using daily data, each point on the chart will represent the average of three days.
2nd Period > > MAV2: This parameter is identical to the parameter explained above. Be aware that when you enter the input data, MAV1 also appears.
3. Triple MAV — displays three moving average lines in one chart window.
1st Period > > MAV1: This parameter lets you enter the Moving Average period and the price information you wish to use. The period is determined by the time interval you are using. For example, if you are using five-minute intervals of data and you enter "3" as the period, each point on the chart will represent the average of three five-minute intervals, totaling 15 minutes. If you are using daily data, each point on the chart will represent the average of three days.
2nd Period > > MAV2, 3rd Period > > MAV3: These parameters are identical to the parameter explained above.
Application
The most basic method of using Moving Averages is to compare the relationship between the Moving Average of a symbol with the symbol's current price. A possible bullish indication is given when the current price rises above the Moving Average, and a possible bearish indication is given when the current price falls below the Moving Average.
Neovest also provides the ability to chart two or three Moving Average lines together. When using a double or triple Moving Average chart, a possible bullish indication is given when the short-term Moving Average rises above the long-term Moving Average, and a possible bearish indication is given when the short-term Moving Average falls below the long-term Moving Average.
Because Moving Averages are averages
of a symbol's prices over a given time period, the time required for the Moving
Average to respond to major price changes is significant. When using Moving
Averages, investors many times miss the initial move of a symbol's price.
Although this may be considered by some to be a disadvantage, the positive
side is that Moving Averages always keep investors on the right side of the
market. They are not easily fooled by sideways markets when a symbol consolidates.
Chart Settings
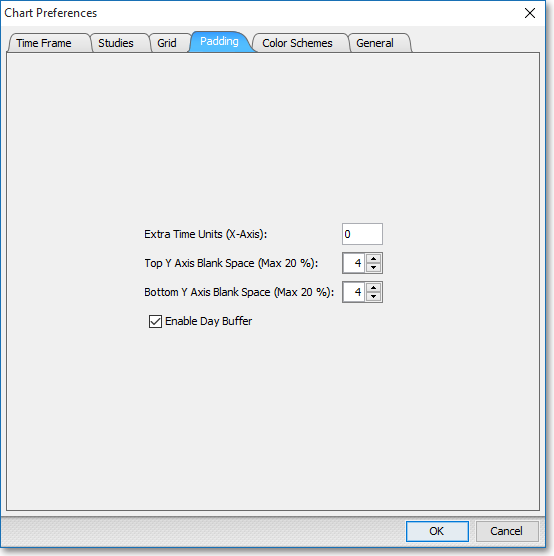
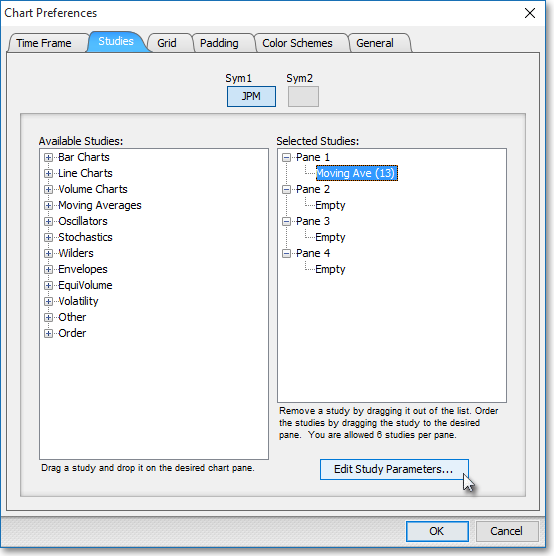
Once a Moving Average is selected in a Chart window, you may click with the right mouse button in the body of the Chart window and select "Preferences" to access the "Studies" tab. Once there, you may select the study you wish to edit (in this example, "Moving Ave (13)" is selected), and then click "Edit Study Parameters" in order to edit the smoothing formulas involved with single, double, or triple Moving Average charts. Differences between the five smoothing formulas are due to the weights assigned to the most recent data.
Simple Moving Average (MAV): This is the most commonly used type of smoothing. It applies equal weight to all prices.
Smoothed Moving Average (SMAV): This Moving Average is similar to the Simple Moving Average. The difference is that the average value is subtracted from the calculation instead of the raw data value. On a Simple Moving Average the raw data is subtracted, but on the Smoothed Moving Average, the average of a specified number of days is subtracted.
Weighted Moving Average (WMAV): This smoothing formula is designed to put more weight on recent data and less on past data. It is calculated by multiplying each previous day's data by a weight that is determined by the number of days in the Moving Average. For example, on a 10-day Moving Average, the most recent price would be multiplied by 10, the previous price by nine, and so on down to one.
Exponentially Smoothed Moving Average (EMAV): This smoothing formula provides another way to give more weight to current data and less weight to past data. The Exponential Formula uses a constant from the equation "2/(n+1)." This constant is known as the "Alpha Factor."
Exponential Smoothing (EXPO): This smoothing formula is exactly the same as the Exponentially Smoothed Moving Average, except that this smooth type allows the user to enter the actual Alpha Factor. This allows for more precision.
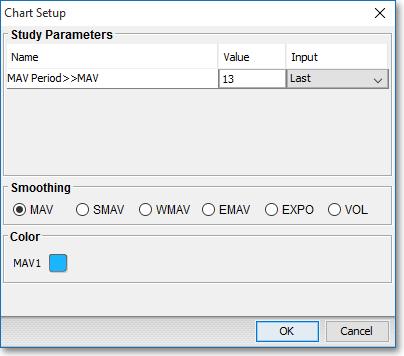
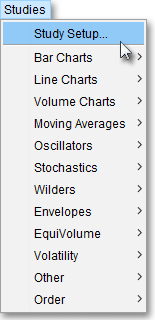
Note: You may also access the "Chart Setup" window by clicking on "Studies" and selecting "Study Setup..." from the drop-down menu.
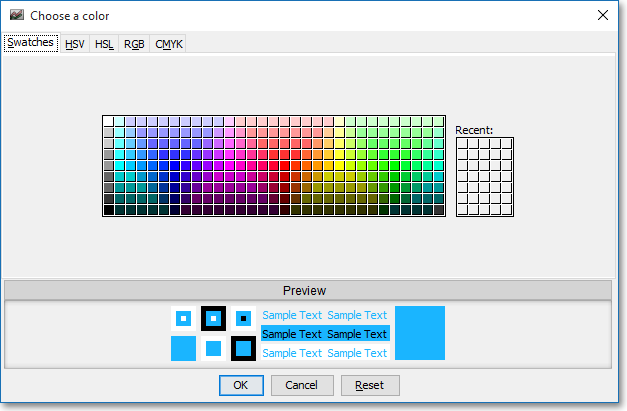
Note: If you wish to change the color of the Chart's lines, simply click on the square to the right of "MAV1" to cause the "Choose a Color" box to appear. The "Choose a Color" box contains five tabs: "Swatches," "HSV," "HSL," "RGB," and "CMYK." The "Swatches" tab lets you select one of several color "swatches" to replace the existing component color of the selected color scheme. The "HSV," "HSL," "RGB," and "CMYK" tabs let you edit the color of the selected swatch. If at any time you do not like the color of the swatch you selected or you do not like the color changes you have made to the swatch itself, click Reset to return to the existing component color of the selected color scheme. Once you have selected a replacement color, click OK.
Formulas
Simple Moving Average (MAV):

Where:
Pi
= Current Price
n = Number of Intervals
Smoothed Moving Average (SMAV):

Where:
SMAVi
= Current SMAV Value
n = Number
of Intervals
Pi
= Current Price
Weighted Moving Average
(WMAV):

Where:
n = Number
of Intervals
Pi
= Current Price
Exponentially Smoothed Moving Average (EMAV):

Where:
n = Number of Intervals
Pi = Current Price
EMAVi = Current EMAV Value
Exponential Smoothing (EXPO):

Where:
a = Alpha Factor (Smoothing Period)
Pi = Current Price
EMAVi = Current EMAV Value