Bar Chart
Introduction
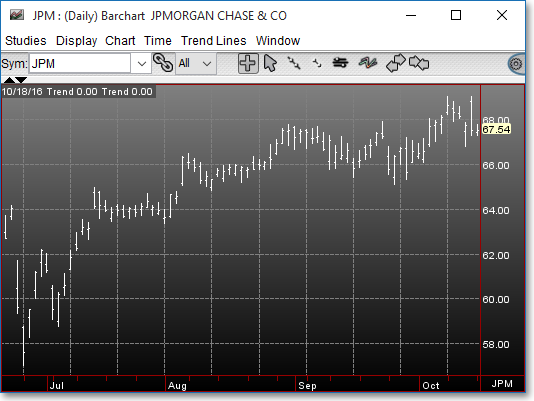
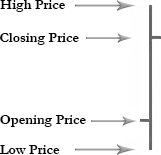
The Bar Chart is the most popular type of chart. It consists of a series of vertical lines that represent a specific time interval (i.e., intraday, daily, weekly, monthly). Each bar represents the high, low, open, and closing prices for that specific time interval. The top of the bar represents the highest price of the given time interval, and the bottom of the bar represents the lowest price of the given time interval. The opening price of the interval is represented by a hash mark on the left side of the bar, and the closing price of the interval is represented by a hash mark on the right side of the bar.