Stochastics
Introduction
The Stochastic process is based on the observation that as prices increase, closing prices tend to accumulate ever closer to the highs for the period. Conversely, as prices decrease, closing prices tend to accumulate ever closer to the lows for that period. Stochastics are popular indicators for sideways markets rather than for markets that are trending.
The Stochastic indicator is designed to show how a symbol's current price relates to its range over a certain period of bars. A typical Stochastic study produces two oscillating lines, the %K and %D. The overbought and oversold areas may vary, but they are traditionally above the 80 percent line for the overbought zone and below the 20 percent line as the oversold zone. When the %K line crosses the %D line below the 20 percent line, the indicator is signaling an oversold signal. When the %K line crosses the %D line above the 80 percent line, it is signaling an overbought signal.
Neovest offers three variations of the Stochastic study:
1. Stochastic Fast: This Stochastic indicator plots two lines. The first line is the Raw %K, and the second line is a three-period moving average of the first line. The
second line is labeled %D.
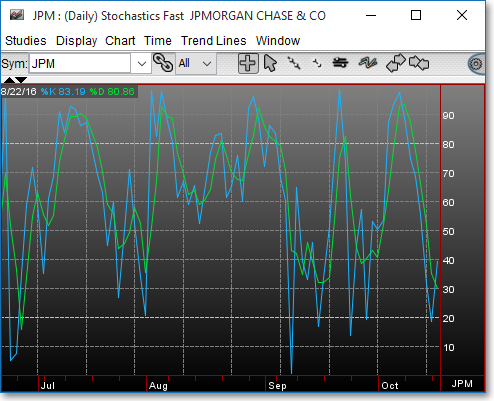
With the Fast Stochastic you have the ability to define the moving average period to be used in the calculation as well as the type of price information that will be used:
Stochastic Period > > %K %D: This lets you enter the number of intervals to be used in the Raw %K formula. In the Input box you may choose Last, Open, High, or Low as the input data to be used in the calculation.
2. Stochastic Slow: The Stochastic Slow indicator lets you plot two smoothed %K and %D lines. The %K is equal to a five-period moving average of the Raw %K,
and the %D line is smoothed an additional three periods using the Slow %K result.
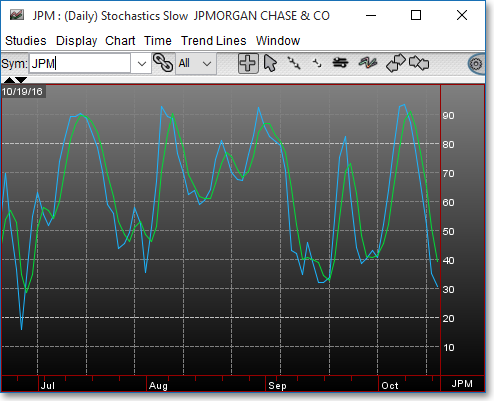
This study also lets you determine the moving average period to be used in the calculation as well as the type of price information that will be used:
Stochastic Period > > %K %D: This lets you enter the number of intervals to be used in the Raw %K formula. In the Input box you may choose Last, Open, High, or Low as the input data to be used in the calculation.
3. Stochastic Variable %K %D: This Stochastic lets you define the moving average period for both the %K and %D lines. Unlike other Stochastic studies, both the
%K and %D lines are calculated directly from the Raw %K, which provides you with complete control over the parameters.
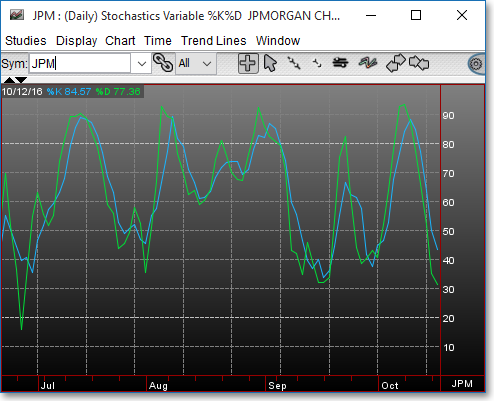
This study also lets you determine the moving average period to be used in the calculation as well as the type of price information that will be used:
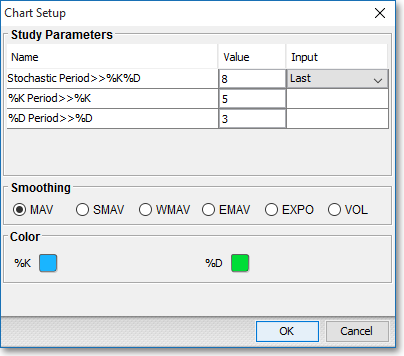
Stochastic Period > > %K %D: This lets you enter the number of intervals to be used in the Raw %K formula. In the Input box you may choose Last, Open, High, or Low as the input data to be used in the calculation.
%K Period > > %K: This lets you enter a moving average period to be used in the calculation of the %K line.
%D Period > > %D:This lets you enter a moving average period to be used in the calculation of the %D line.
Application
There are several ways to interpret the Stochastic oscillator. Four popular methods are as follows:
1. Look for a bullish indication as the Stochastic line (either %K or %D) crosses below a certain point (e.g., the 20 percent line) and then comes back through the same point. Look for a bearish indication when the Stochastic line breaks a certain level (e.g., the 80 percent line) and then falls back through that level.
2. Look for a bullish indication when the %K line crosses above the %D line, and look for a bearish indication when the %K line crosses below the %D line.
3. When a stock has made a high, then falls, and then sets a new high, while simultaneously the corresponding peaks of the %D line have made a high and then a lower high—then a bearish indication has been given.
4. When a stock has a made a low, begins to rise and then falls again breaking the old low, while simultaneously the corresponding %D values have made a low
and then a higher low—then a bullish indication has been given.
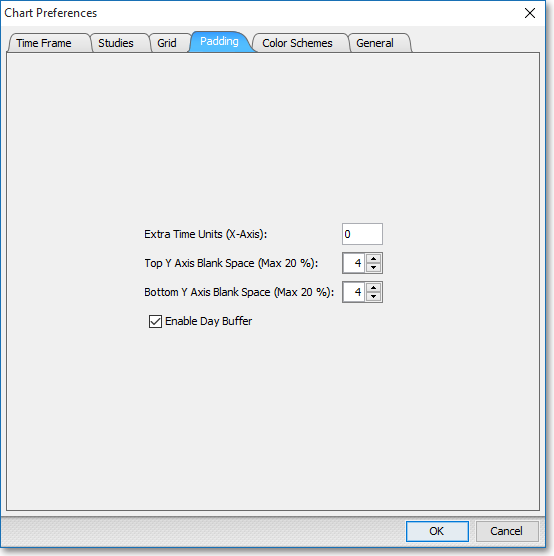
Chart Settings
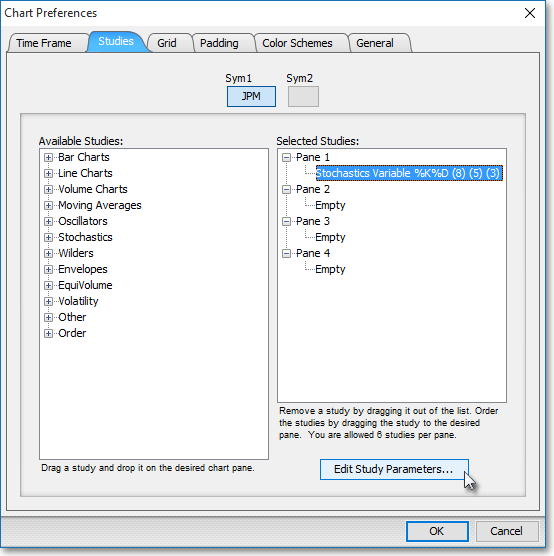
Once a Stochastic technical indicator is selected in a Chart window, you may click with the right mouse button in the body of the Chart window and select "Preferences" to access the "Studies" tab. Once there, you may select the study you wish to edit (in this example, "Stochastics Variable %K%D (8) (5) (3)" is selected), and then click "Edit Study Parameters" in order to specify certain variables to be used to chart the Stochastic studies.
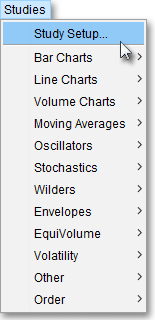
Note: You may also access the "Chart Setup" window by clicking on "Studies" and selecting "Study Setup..." from the drop-down menu.
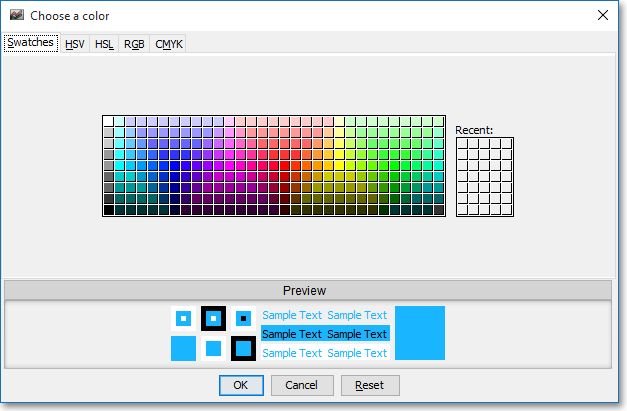
Note: If you wish to change the color of the Chart's lines, simply click on the square to the right of "%K" or "%D" respectively to cause the "Choose a Color" box to appear. The "Choose a Color" box contains five tabs: "Swatches," "HSV," "HSL," "RGB," and "CMYK." The "Swatches" tab lets you select one of several color "swatches" to replace the existing component color of the selected color scheme. The "HSV," "HSL," "RGB," and "CMYK" tabs let you edit the color of the selected swatch. If at any time you do not like the color of the swatch you selected or you do not like the color changes you have made to the swatch itself, click Reset to return to the existing component color of the selected color scheme. Once you have selected a replacement color, click OK.
Formula
Where:
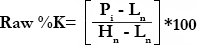
P = Current Price
Ln = The Lowest Low in "n" intervals
Hn = The Highest High in "n" intervals
n = Stochastic Period