Smoothed Accumulation Distribution
Introduction
The Smoothed Accumulation Distribution study will display two lines on the chart. The first line is the raw Accumulation Distribution line. The second line is the smoothed version of the Accumulation Distribution line. The Smoothed Accumulation Distribution line causes the Accumulation Distribution to be less choppy and significantly easier to interpret.
Application
Divergences between the Accumulation Distribution and a symbol's price are a good signal of a reversal. When prices are making new highs but the Accumulation Distribution is making new lows, prices will usually change to confirm the Accumulation Distribution's trend.
Accumulation Distribution is also a good indicator of continuations of current trends. For example, when a symbol is in a strong upward trend and the Accumulation Distribution is also in a strong upward trend, it is a good sign that the trend will continue. The same is true if the symbol and its Accumulation Distribution are in a strong downward trend. For this reason, it is useful to use the Accumulation Distribution indicator with a trend-following indicator.
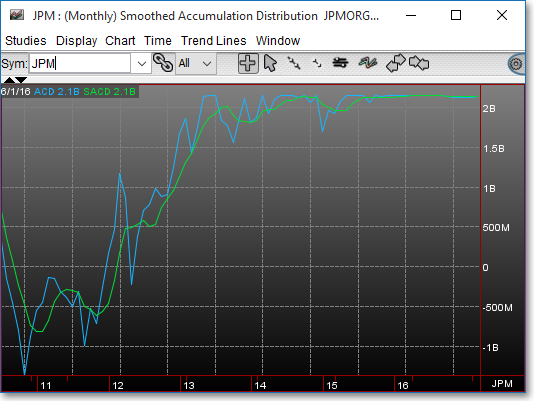
Chart Settings
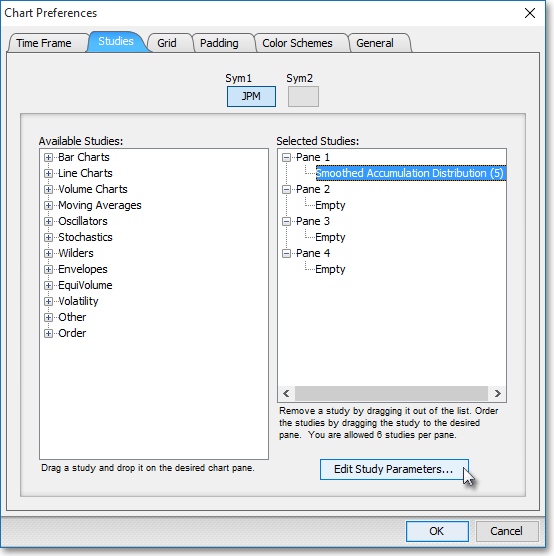
Once the Smoothed Accumulation Distribution technical indicator is selected in a Chart window, you may click with the right mouse button in the body of the Chart window and select "Preferences" to access the "Studies" tab. Once there, you may select the study you wish to edit (in this example, "Smoothed Accumulation Distribution (5)" is selected), and then click "Edit Study Parameters" in order to calculate the Accumulation Distribution. You will also see that you have the ability to determine the period of smoothing.
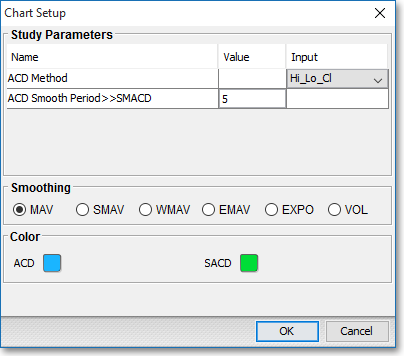
ACD Method > > ACD: This parameter lets you choose the method of calculation you wish to use: Chaikin's Midpoint method (High/Low/Close), Granville's Previous Close method (PrevClose), or Williams' Open to Close method (Open). The default is Chaikin's Midpoint method.
ACD Smooth Period > > SMACD: This parameter lets you enter a moving average period for a smoothed version of the Raw Accumulation Distribution line. The default on this setting is a five-day moving average.
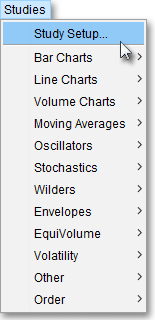
Note: You may also access the "Chart Setup" window by clicking on "Studies" and selecting "Study Setup..." from the dropdown menu.
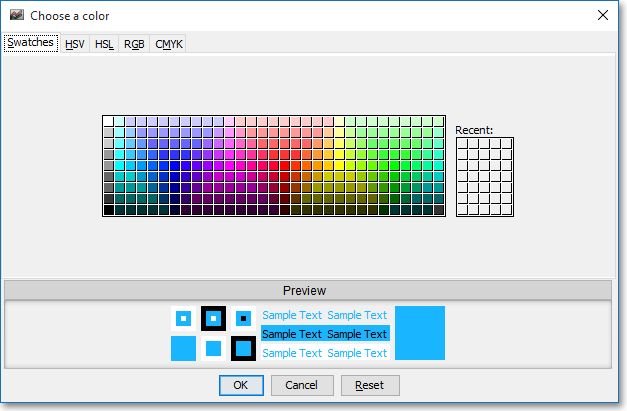
Note: If you wish to change the color of the Chart's lines, simply click on the square to the right of "ACD" or "SACD" respectively to cause the "Choose a Color" box to appear. The "Choose a Color" box contains five tabs: "Swatches," "HSV," "HSL," "RGB," and "CMYK." The "Swatches" tab lets you select one of several color "swatches" to replace the existing component color of the selected color scheme. The "HSV," "HSL," "RGB," and "CMYK" tabs let you edit the color of the selected swatch. If at any time you do not like the color of the swatch you selected or you do not like the color changes you have made to the swatch itself, click Reset to return to the existing component color of the selected color scheme. Once you have selected a replacement color, click OK.
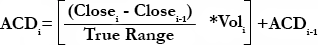
Formula
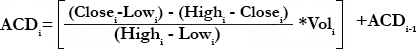
Chaikin's Midpoint Method (High-Low-Close):
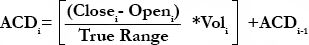
Williams' Open to Close Method (Open):
Granville's Previous Close Method (PrevClose):