Studies Tab
Features in the "Studies" tab in Neovest's "Chart Preferences" box let you add and remove technical indicators to and from individual chart panes in a Neovest Chart window. This tab also lets you edit the parameters of the technical indicators that have been added to chart panes in a Chart window.
In addition, you may automatically add chart panes to a Neovest Chart window via this tab simply by adding a technical indicator to an "Empty" chart pane.
Neovest provides over 35 technical indicators and charting tools that you may use to pinpoint the very best times to trade symbols. Neovest provides descriptions of all its technical indicators. To access the descriptions of the technical indicators that are available in Neovest, refer to the "Indicator Definitions" section in the "Chart" chapter of Neovest's Help documentation.
The following instructions explain how you may add a technical indicator to a chart pane in a Neovest Chart window:
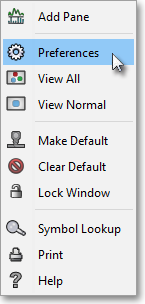
With a Chart window open on your screen, click the gear icon, located on the far-right of the toolbar.

Click the "Preferences" icon on the drop-down menu that appears.
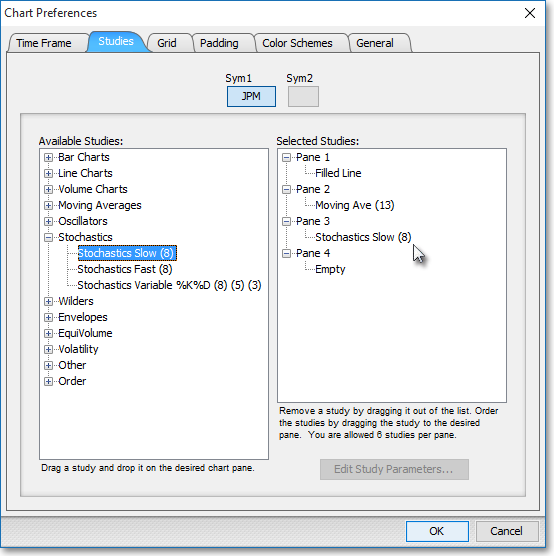
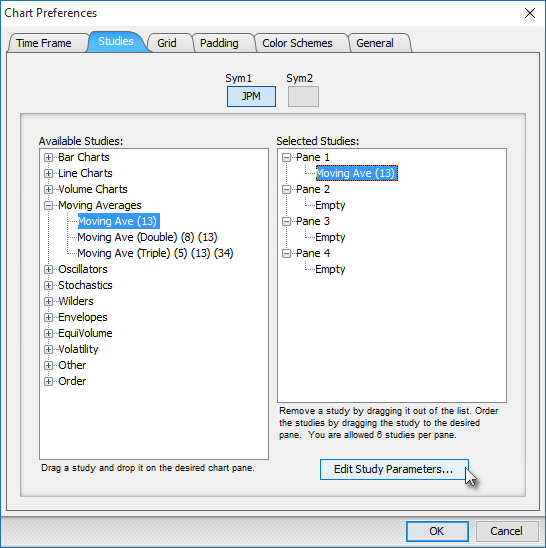
Once the "Chart Preferences" box appears, select the "Studies" tab.
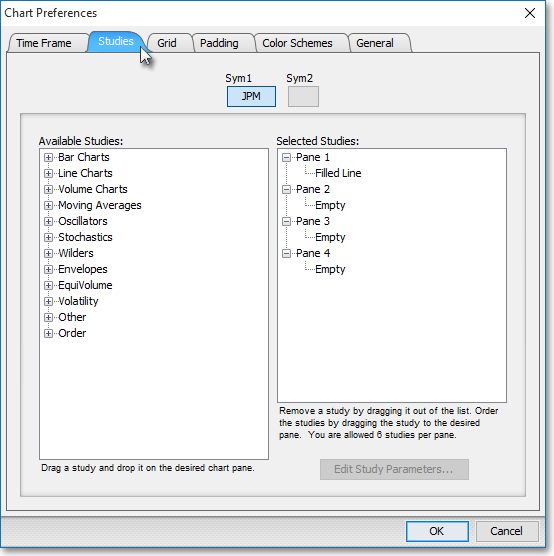
Click on either "Sym1" or "Sym2" to select the symbol for which you would like to add a technical indicator.
Note: If you have not previously added a second symbol to the open Chart window, you may skip this step.

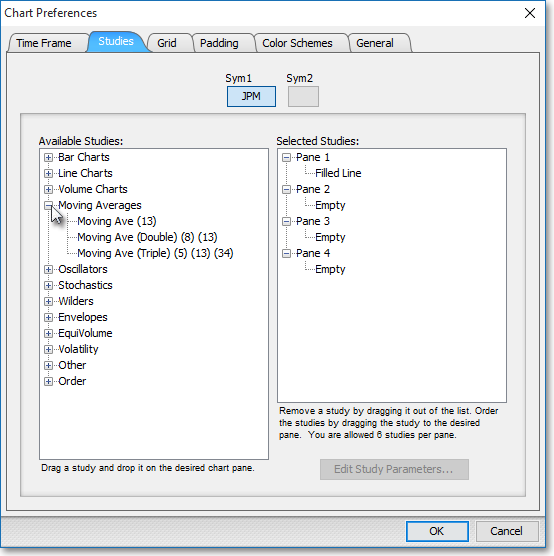
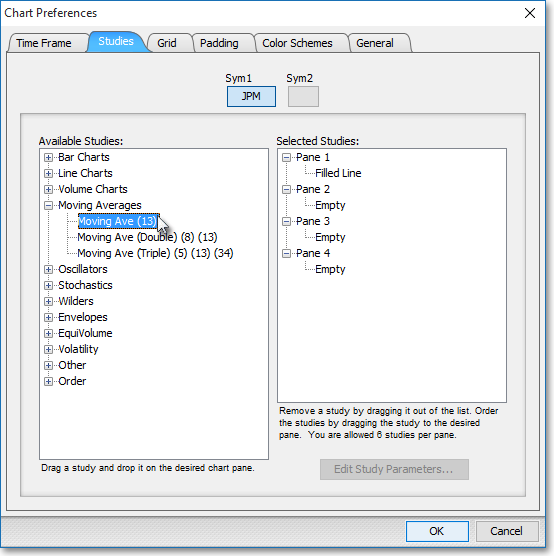
Click on the plus sign ("+") associated with a technical indicator group to expand the group in the "Available Studies" section.
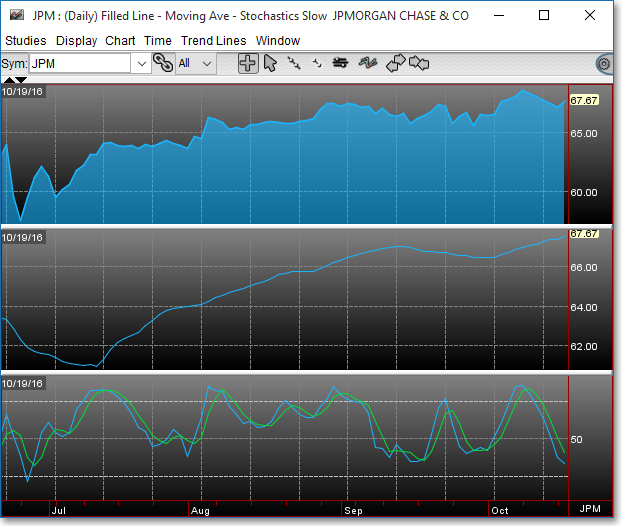
Click on a technical indicator and drag the technical indicator to the chart pane you wish in the "Selected Studies" section.
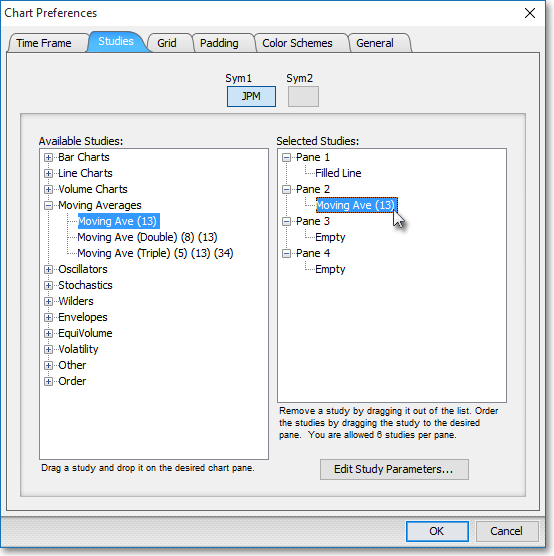
Note (1): The "Selected Studies" section lists the technical indicators that have been added to individual chart panes in a Neovest Chart window. At this point you may continue to add technical indicators to individual chart panes in the "Selected Studies" section by following the preceding instructions.
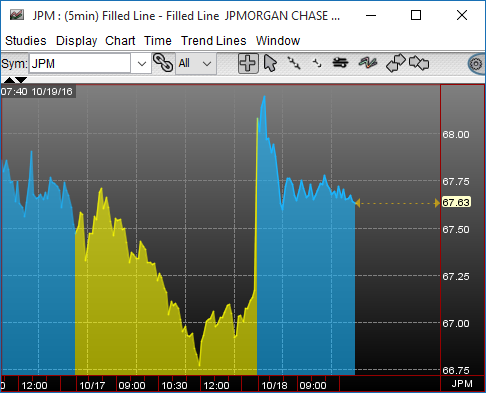
Note (2): If you drag a technical indicator to an "Empty" chart pane in the "Selected Studies" section, then Neovest will automatically add the chart pane to the Chart window.
Once you have finished adding the technical indicators you wish, click OK.

Note: Neovest lets you add up to four different technical indicators per chart pane. If you have added more than one technical indicator to a chart pane, then Neovest will attach a small down arrow to the upper-right outside corner of the chart pane. If you click on the small down arrow, a menu will appear that will list the technical indicators that have been added to the chart pane. If you click on one of the technical indicators on the menu, then Neovest will change the Y axis of the pane to reveal the scale of the selected technical indicator.
The following instructions explain how you may remove a technical indicator from a chart pane in a Neovest Chart window:
With a Chart window open on your screen, click the gear icon, located on the far-right of the toolbar.
Click the "Preferences" icon on the drop-down menu that appears.
Once the "Chart Preferences" box appears, select the "Studies" tab.
Click on either "Sym1" or "Sym2" to select the symbol for which you would like to remove a technical indicator.
Note: If you have not previously added a second symbol to the open Chart window, you may skip this step.
Click on a technical indicator in a chart pane in the "Selected Studies" section, and drag the technical indicator to the "Available Studies" section.
Note (1): The "Selected Studies" section lists the technical indicators that have been added to individual chart panes in a Neovest Chart window. At this point you may continue to remove technical indicators from individual chart panes in the "Selected Studies" section by following the preceding instructions. Note (2): If you drag a technical indicator from a chart pane in the "Selected Studies" section and the chart pane becomes "Empty," then Neovest will automatically remove the chart pane from the Chart window.
Once you have finished removing the technical indicators you wish, click OK.
The following instructions explain how you may edit the parameters of a technical indicator that has been added to a chart pane in a Neovest Chart window:
With a Chart window open on your screen, click the gear icon, located on the far-right of the toolbar.
Click the "Preferences" icon on the drop-down menu that appears.
Once the "Chart Preferences" box appears, select the "Studies" tab.
Click on either "Sym1" or "Sym2" to select the symbol for which you would like to edit a technical indicator.
Note: If you have not previously added a second symbol to the open Chart window, you may skip this step.
Click on the technical indicator in the "Selected Studies" section whose parameters you wish to edit.
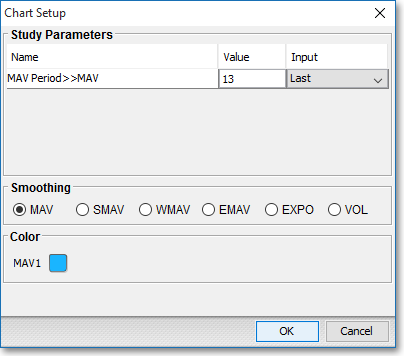
Click Edit Study Parameters to access the "Chart Setup" box.
Note: The "Chart Setup" box updates to reveal the specific parameters of each technical indicator you choose to edit. In the following graphic, the "Chart Setup" box displays the parameters for the Moving Ave (Double) technical indicator.
Note: Rather than list each set of parameters for each of Neovest's technical indicators at this point, the following table lists the parameters for the Moving Ave (Double) technical indicator. The following table also explains how you may change the parameters of the Moving Ave (Double) technical indicator. To access the descriptions of all of Neovest's technical indicators, refer to the "Technical Indicators" section in the "Chart" chapter of Neovest's Help documentation.
| Feature: |
Description: |
| Name | Lists the various parameters of a specific technical indicator that may be edited. |
| Value | Lists the value used to calculate each parameter of a specific technical indicator. In this example, "8" refers to an eight-bar average used to calculate the "1st Period>>MAV" line. You may change the value used to calculate each parameter simply by highlighting the current "Value" and then typing a different number. |
| Input | Lists the data used to calculate each parameter of a specific technical indicator. In this example, "Last" refers to the last price (or close) of each bar to calculate the "1st Period>>MAV" line. You may change the input data used to calculate each parameter simply by clicking on the "Input" down arrow and selecting the input data you wish from the menu that appears. |
| Smoothing | Used when calculating moving averages, the six "Smoothing" options are used frequently with many additional Neovest technical indicators. |
| Color | Lets you change certain component colors of the particular technical indicator that you have selected for a Neovest Chart window. Once you click on the colored square to the right of a technical indicator component, the "Choose a Color" box will appear. The "Choose a Color" box contains three tabs: "Swatches," "HSB," and "RGB." The "Swatches" tab lets you select one of several color "swatches" to replace the existing component color of the selected technical indicator. The "HSB" and "RGB" tabs let you edit the color of the selected swatch. If at any time you do not like the color of the swatch you selected or you do not like the color changes you have made to the swatch itself, click Reset to return to the existing component color of the selected technical indicator. Once you have selected a replacement color, click OK. |
Once you have finished editing the parameters of the selected technical indicator, click OK.