Chart Window Technical Indicators
In addition to the basic bar chart, candlestick, and line price symbol data that may be displayed in a Chart window, Neovest provides several advanced technical indicators that may be applied to any symbol in any open Chart window or Chart pane.
Neovest provides over 35 technical indicators and charting tools that you may use to pinpoint the very best times to trade individual symbols. Neovest provides descriptions of all its technical indicators. To access the descriptions of the technical indicators that are available in Neovest, refer to the "Indicator Definitions" section in the "Chart" chapter of Neovest's Help documentation.
Furthermore, Neovest lets you edit the parameters of each of its technical indicators. For information on how you may edit the parameters of Neovest's technical indicators, refer to the "Studies Tab" in the "Chart Preferences" section in Neovest's Help documentation.
The following instructions explain how you may select a technical indicator to load into an open Neovest Chart window or Chart pane:
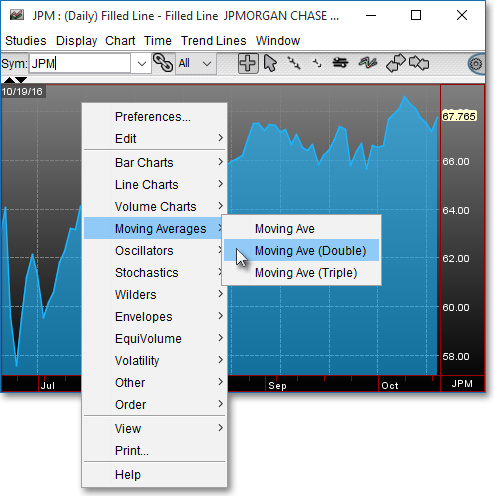
Click with the right mouse button in the body of the open Chart window or Chart pane into which you would like to load a technical indicator.
Move the mouse cursor over a technical indicator category (e.g., Line Charts, Volume Charts, Moving Averages, etc.) to access the submenu of technical indicators available in each category, and select the technical indicator you wish.
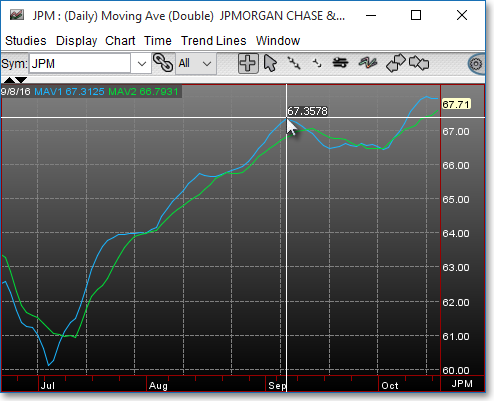
Note (1): You may overlay certain technical indicators on existing technical indicators in an open Chart window or Chart pane. For example, by following thepreceding instructions, you may overlay a Moving Ave (Double) technical indicator on an existing bar chart. For those types of technical indicator overlays that Neovest does not support, Neovest will simply replace the existing technical indicator in an open Chart window or Chart pane with the newly selected technical indicator.
Note (2): Once a technical indicator is loaded into an open Chart window or Chart pane, you may click and hold with the status cursor (the crosshairs cursor) in the open Chart window or Chart pane, and Neovest will display calculated numerical data for the technical indicator(s) in the "Info" box that appears.