Candlestick Chart
Introduction
The Candlestick Chart originated in Japan during the 1600s to analyze the price of rice contracts. Steve Nison is credited with popularizing this charting technique in the United States.
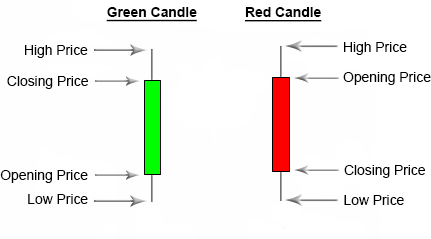
Candlestick Charts display open, high, low, and closing prices similar to Bar Charts but with more emphasis on the relationship between the opening and closing prices. Candlestick Charts have a thick body that represents the range between the opening and closing prices. The body of the candle will be green if a stock closes higher than it opened, and if a stock closes lower than it opened, the body of the candle will be red.
There are several ways to interpret and use Candlestick Charts. The best sources for trading with Candlestick Patterns are outlined in Steve Nison's two books, Japanese Candlestick Charting Techniques and Beyond Candlesticks.