Momentum
Introduction
The Momentum indicator is based on the amount of movement in a symbol's price over a given time period. The more the symbol has moved, the greater the indicator will be. By measuring the current price against historical prices, a trader may formulate an opinion concerning the current trend and whether it will continue or reverse.
Application
There are basically two different ways to use the Momentum Indicator:
1. The Momentum Oscillator is very similar to the MACD in that it is highly related to the securities current trend. A bullish indication is given as the indicator
reaches the bottom and starts to turn up, and a bearish indication is given as the indicator peaks and turns down.
2. As the symbol sets new highs, the Momentum indicator will climb sharply and then reverse, diverging from the continued trend in price and indicating a potential
reversal. Similarly, as the symbol is setting new lows, the Momentum indicator will drop sharply and then reverse, thereby diverging from the continued trend in price and indicating a potential up reversal.
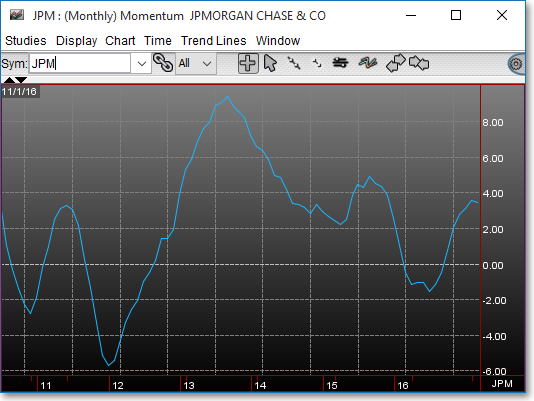
Chart Settings
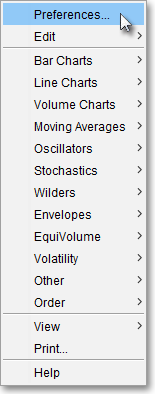
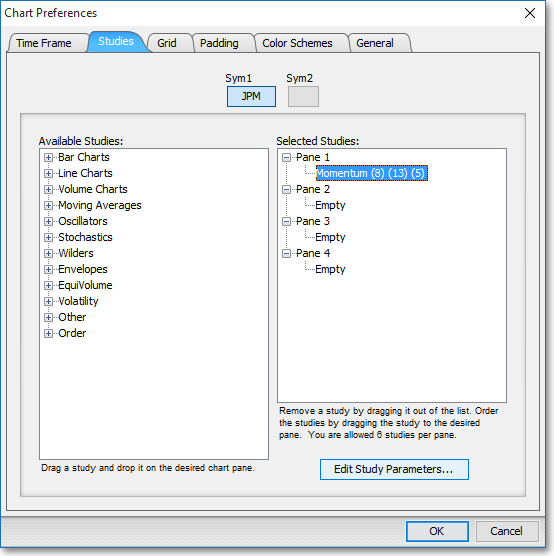
Once the Momentum technical indicator is selected in a Chart window, you may click with the right mouse button in the body of the Chart window and select "Preference" to access the "Studies" tab. Once there, you may select the study you wish to edit (in this example, "Momentum (8) (13) (5)" is selected), and then click "Edit Study Parameters" in order to select the moving average period and price data to be used in the Momentum calculation.
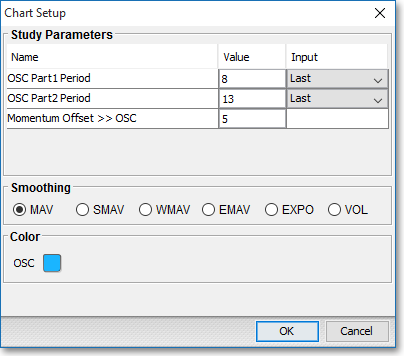
OSC Part1 Period: This parameter lets you define the moving average period (Value) and the type of price information (Input Data) to be used for the first moving average line of the difference calculation.
OSC Part2 Period: This parameter lets you define the moving average period (Value) and the type of price information (Input Data) to be used for the second moving average line in the difference calculation. The difference of the first moving average line (OSC Part1) and the second moving average line (OSC Part2) will result in a Difference Oscillator (OSC), which will appear on the chart.
Momentum Offset > > OSC: The Momentum Offset lets you shift the second moving average line back "n" units before it is subtracted from the other line. The "n" number of units is entered in the Value field.
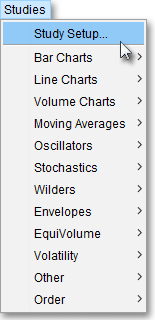
Note: You may also access the "Chart Setup" window by clicking on "Studies" and selecting "Study Setup..." from the drop-down menu.
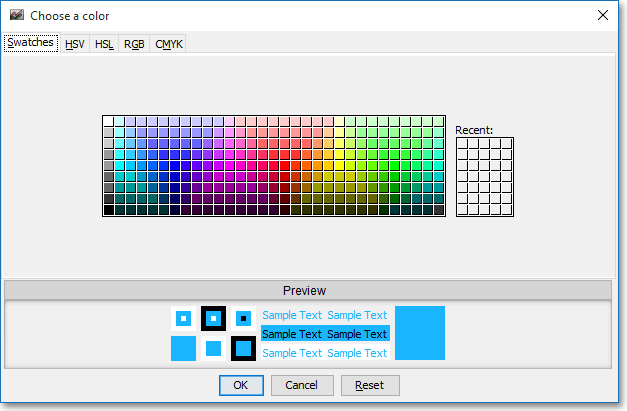
Note: If you wish to change the color of the Chart's lines, simply click on the square to the right of "OSC" respectively to cause the "Choose a Color" box to appear. The "Choose a Color" box contains five tabs: "Swatches," "HSV," "HSL," "RGB," and "CMYK." The "Swatches" tab lets you select one of several color "swatches" to replace the existing component color of the selected color scheme. The "HSV," "HSL," "RGB," and "CMYK" tabs let you edit the color of the selected swatch. If at any time you do not like the color of the swatch you selected or you do not like the color changes you have made to the swatch itself, click Reset to return to the existing component color of the selected color scheme. Once you have selected a replacement color, click OK.
Formula
Momentum = 100(Pi– Pi-n)
Where:
Pi = Current Price
Pi-n = Price "n" days ago (The trader determines the
value of "n")