Line Chart
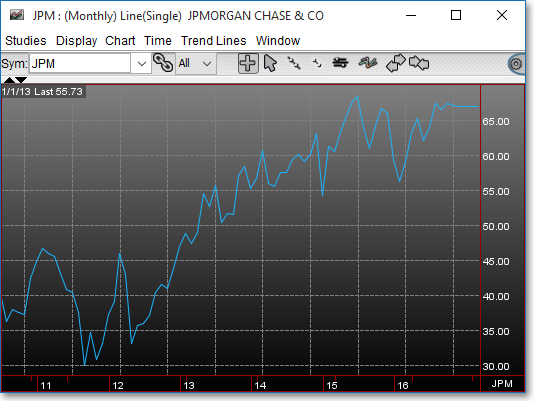
The Line Chart is the simplest type of chart. A Line Chart is a connected line of price changes. It is usually displayed using closing prices but can also be used on high, low, or opening prices.
You may also plot double and triple line charts. This function lets you view high, low, opening, and closing prices of a symbol, future, or index all at the same time.