Volatility SAR
Introduction
The Volatility System was developed by Welles Wilder. The Volatility SAR (Stop and Reversal) is a trend-following system that helps investors determine when the market is trending and when it is in a sideways movement. The Volatility SAR measures the volatility of a symbol by measuring the Average True Range, or the range of a price movement over a specific time interval.
The volatility used with this indicator differs from the volatility used with historic volatility. Historic volatility measures the variance of price surrounding the average price to reach a calculation. Volatility SAR measures the total price movement over a specific time interval to reach a calculation.
Similar to the Parabolic SAR, the Volatility SAR is defined by a small dot that is located above or below the bars of a bar chart. When the SAR value is above the bar, the symbol is in a downtrend, and when the SAR is below the bar, the symbol is in an uptrend.
Application
Uses of the Volatility SAR are very similar to those of the Parabolic SAR. For example, you may use the Volatility SAR for determining entry and exit points. For exit points, look for a bearish indication when the SAR value rises above the price of a symbol after a significant uptrend. For entry points, look for a bullish indication when the price rises above the SAR value after a significant downtrend.
For more detailed information about the Volatility System, refer to Mr. Wilder's book, New Concepts in Technical Trading Systems.
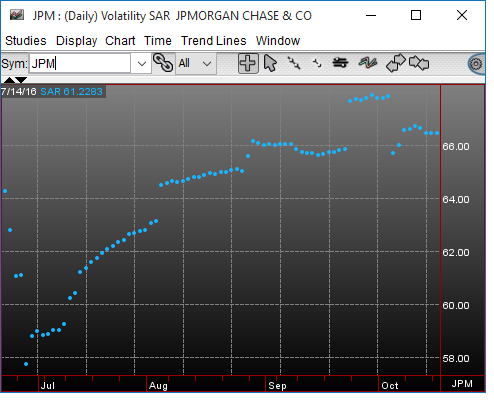
Chart Settings
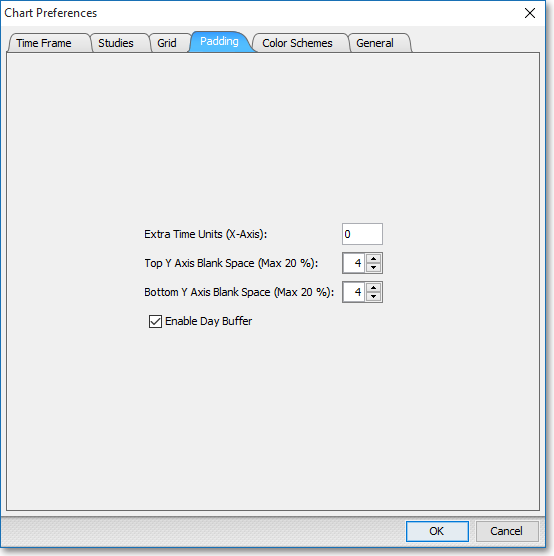
Once the Volatility SAR technical indicator is selected in a Chart window, you may click with the right mouse button in the body of the Chart window and select "Preferences" to access the "Studies" tab. Once there, you may select the study you wish to edit (in this example, "Volatility SAR (8) (200)" is selected), and then click "Edit Study Parameters" in order to specify the number of intervals and Volatility Constant to be used in the calculation of the Volatility SAR.
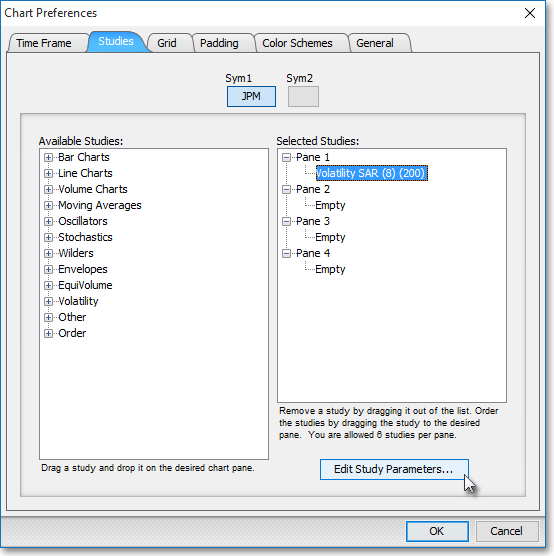
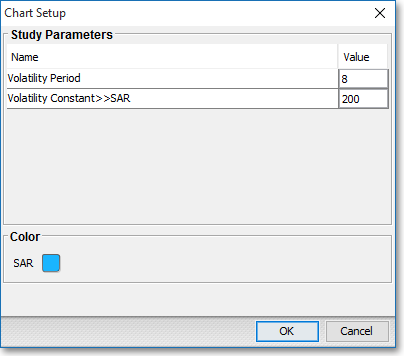
Volatility Period: This parameter lets you enter the number of time intervals to be used in the volatility calculation.
Volatility Constant > > SAR: This parameter lets you enter the Volatility Constant to be used in the volatility calculation.
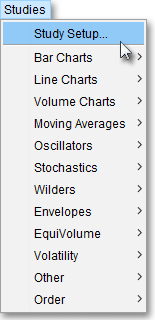
Note: You may also access the "Chart Setup" window by clicking on "Studies" and selecting "Study Setup..." from the drop-down menu.
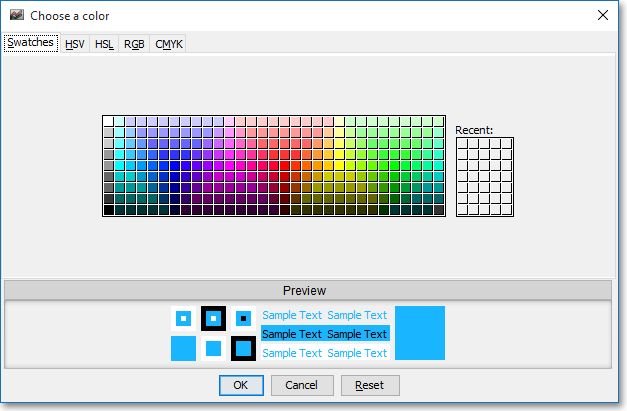
Note: If you wish to change the color of the Chart's lines, simply click on the square to the right of "SAR" respectively to cause the "Choose a Color" box to appear. The "Choose a Color" box contains five tabs: "Swatches," "HSV," "HSL," "RGB," and "CMYK." The "Swatches" tab lets you select one of several color "swatches" to replace the existing component color of the selected color scheme. The "HSV," "HSL," "RGB," and "CMYK" tabs let you edit the color of the selected swatch. If at any time you do not like the color of the swatch you selected or you do not like the color changes you have made to the swatch itself, click Reset to return to the existing component color of the selected color scheme. Once you have selected a replacement color, click OK.
Formula
Vi = EP ± (ATRi* VC)
Where:
EP = Extreme Price Point
VC = Volatility Constant
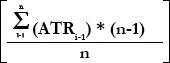
TRi =
The largest of:
– High - Previous Close
– High - Low
– Low - Previous Close
ATRi =