Chart Symbol Overlay
Neovest lets you enter a second symbol in an open Chart window, thus allowing you to compare the current and historical trading activity of two different symbols over the course of the same time period.
This feature is especially useful if you wish to compare two symbols in the same industry or if you wish to compare a single symbol to an index.
The following instructions explain how to enter a second symbol in an open Neovest Chart window:
Click the "Symbol Overlay" icon on an open Chart window's toolbar.

Once the "Sym 2" box appears near the top of the open Chart window, type the second symbol you wish in the box, and press the Enter key.
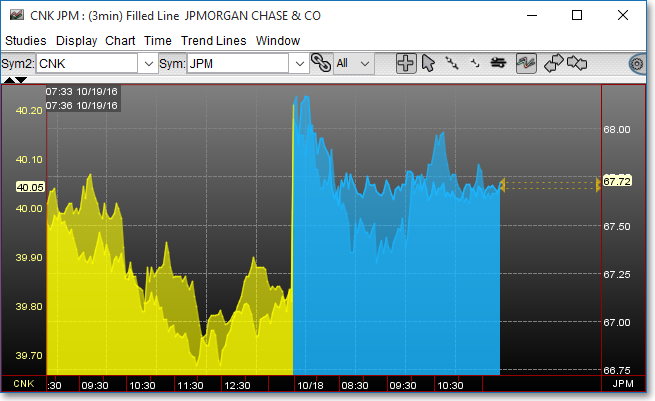
Note: As soon as you enter a second symbol in a Neovest Chart window, Neovest will load symbol data for the second symbol in a different color than that of the first symbol you entered. Neovest will also add a second price grid to the Chart window to reflect the price range of the second symbol.