Padding Tab
Features in the "Padding" tab in Neovest's "Chart Preferences" box let you increase and decrease the X and Y axis in a Neovest Chart window.
The following instructions explain how you may increase and decrease the X and Y axis in a Chart window:
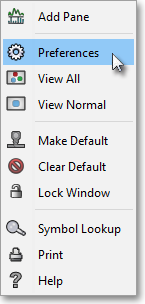
With a Chart window open on your screen, click the gear icon, located on the far-right of the toolbar.

Click the "Preferences" icon on the drop-down menu that appears.

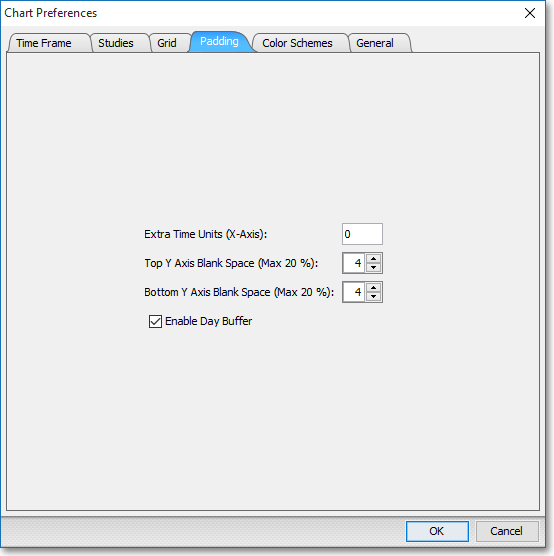
Once the "Chart Preferences" box appears, select the "Padding" tab.

The following table provides descriptions of the features in the "Padding" tab:
| Feature: | Description: |
| Extra Time Units (X Axis) | Lets you enter a larger number than the default of "0" if you wish to increase the amount of space between the Chart window's symbol data and the right border in the Chart window. |
| Top Y Axis Blank Space | Lets you enter a larger or smaller number than the default of "4" to increase or decrease the space between the Chart window's symbol data and the top border in the Chart window. |
| Bottom Y Axis Blank Space | Lets you enter a larger or smaller number than the default of "4" in the "Bottom Y Axis Blank Space" box to increase or decrease the space between the Chart window's symbol data and the bottom border in the Chart window. |
| Enable Day Buffer |
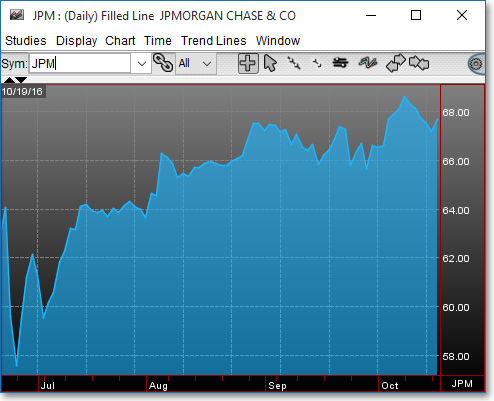
Lets you choose to fill the area on a particular intraday chart between the current trading time and the end of the trading day with blank space (see "Figure 1").
Note: This feature operates only during market hours. |
Figure 1.
