Average Range/Keltner Channel
Introduction
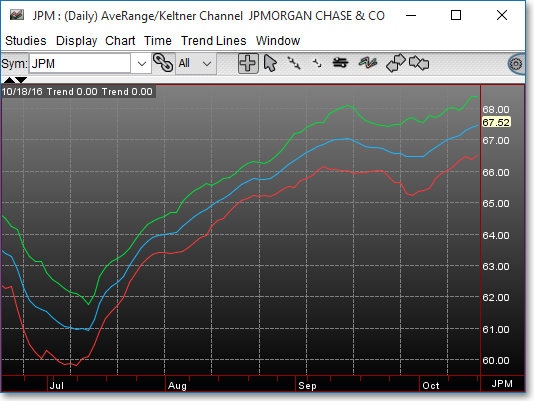
The Average Range/Keltner Channel consists of a moving average line with two channel lines above and below it. It is very similar to Bollinger Bands and Envelopes.
The Channel Lines are determined by a range calculation over a specified time interval. The parameters of this study allow you to define the position and smoothing of the channel lines.

Application
The application of the Keltner Channel is similar to that of Bollinger Bands and Envelopes. Prices tend to stay within the bands. It is generally a good time to buy when prices reach the lower band and sell short when prices reach the upper band.
Chart Settings
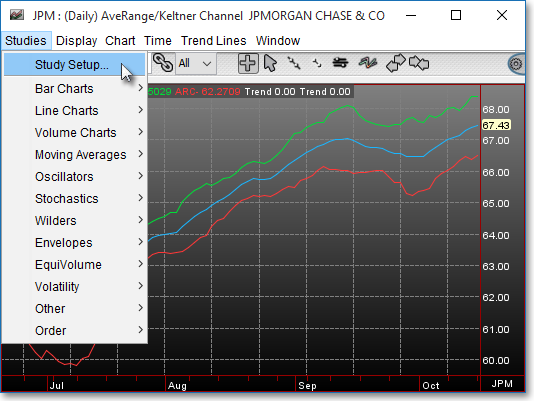
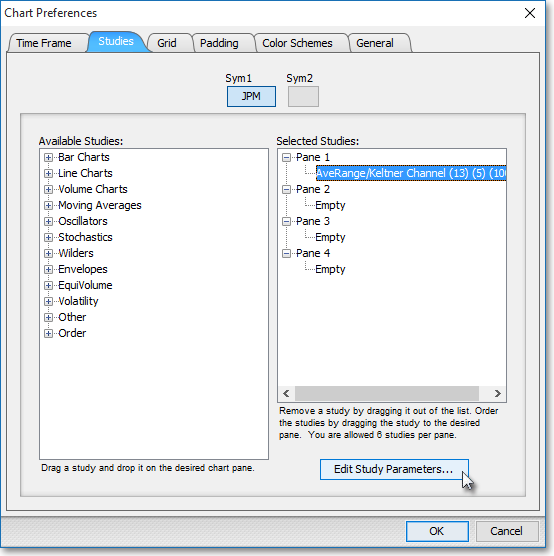
Once the Average Range/Keltner Channel technical indicator is selected in a Chart window, you may then click Studies in the top left corner and select Study Setup to access the "Chart Preferences" box.

Next, highlight "AveRange/Keltner Channel" and click on Edit Study Parameters.

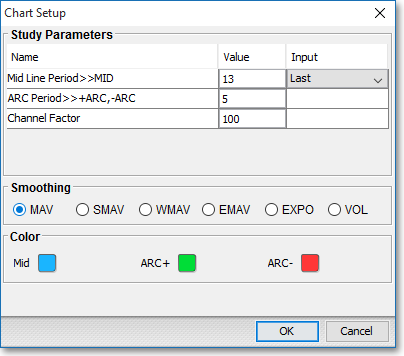
This will bring up the "Chart Setup" box.

Once there, you may specify the moving average, ARC period, and channel factor you wish to use in the calculation of the Keltner Channel.
Mid Line Period > > MID: This parameter lets you enter the moving average period and the type of price information used for the center moving average line. The default setting for the moving average is 13 days.
ARC Period > > +ARC, -ARC: The ARC period lets you enter the value used in the ARC calculation. These are the two lines that appear above and below the midline. They cannot be edited separately. The default setting for this parameter is 5.
Channel Factor: The Channel Factor is a multiplying factor that adds space between the +ARC and -ARC lines and the midline. The larger the number is, the further away the envelope lines will be drawn from the midline. The default setting for this parameter is 100.
Formula
+ARC = (Mid Line) + (ARC * Channel Factor)
-ARC = (Mid Line) - (ARC * Channel Factor)
