Commodity Channel Index
Introduction
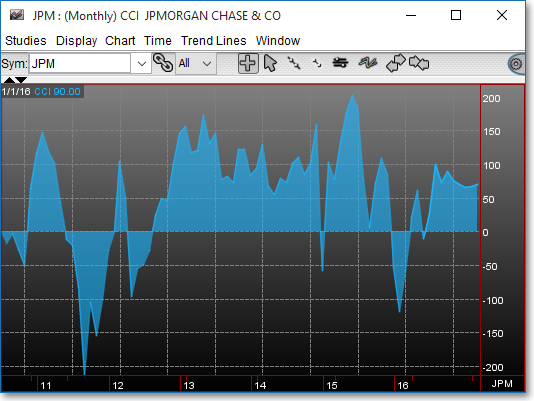
The Commodity Channel Index (CCI) was originally designed as a timing system for commodity contracts that demonstrated cyclical or seasonal characteristics. CCI scores were built to measure the securities variation from its typical pricing average, thereby determining when the cycle was about to reverse. Contrary to its name, the CCI technical indicator is a popular and effective technical indicator for equities as well as commodities.
Application
Two basic methods are used for interpretation of the CCI: (1) Divergences in the CCI indicator from the current price and (2) ±100 values that generate either an overbought or oversold indication.
1. The divergence method is best used while a symbol's price is continuing to set new highs, since the CCI indicator will not rise with the price; thus, a divergence
between the price and the CCI will likely be the result. The CCI-price divergence typically precedes a price correction in the symbol.
2. The overbought signal is triggered when the CCI rises above the +100 level. This implies that long positions should be sold. The same technique is likewise used
as the CCI crosses the -100 level, indicating that short positions should be watched closely.
Chart Settings
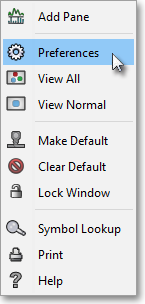
Once the CCI technical indicator is selected in a Chart window, you may click with the right mouse button in the body of the Chart window and select "Preference" to access the "Studies" tab. Once there, you may select the study you wish to edit (in this example, "CCI (20)" is selected), and then click "Edit Study Parameters" in order to specify the number of periods as well as the type of price data that will be used in the CCI calculation.
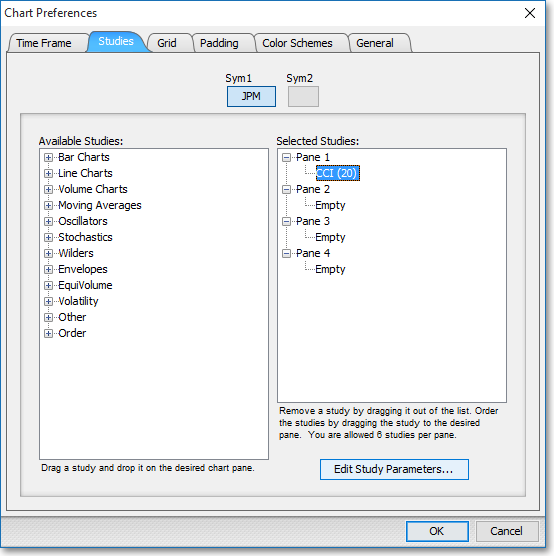
CCI Period > > CCI: This parameter lets you enter the number of periods to be used in the CCI calculation. The number of periods entered in the "Value" field will be used for the moving average and the mean deviation calculations. Here you may also specify the type of price data to be used in the calculation.
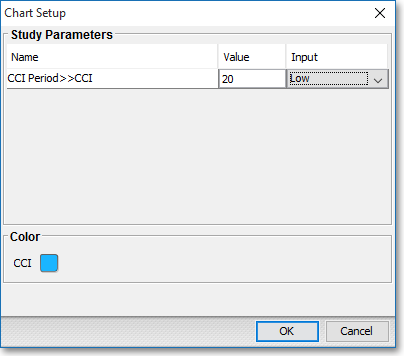
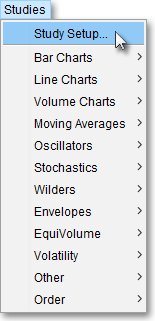
Note: You may also access the "Chart Setup" window by clicking on "Studies" and selecting "Study Setup..." from the drop-down menu.
Formula
There are four steps involved in the CCI calculation:
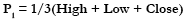
1. Compute
today's typical price using the high, low, and closing prices:
2. Compute
a moving average of the most recent typical prices:
 =
m
=
m
Where:
P1 = Typical Price of Each Day
n1 = Number
of Intervals Used in the Calculation
3. Compute the Mean Deviation of the most recent typical
prices:
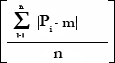 =
MD
=
MD
Where:
n = Number of Intervals
Pi = Current Price
m = Moving Average
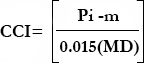
4. Compute the Commodity Channel Index: