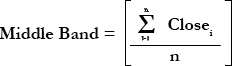
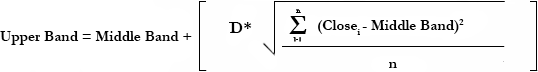
Bollinger Bands
Introduction
Bollinger Bands were created by John Bollinger. Bollinger Bands are a measure of volatility similar to Percentage Envelopes. The difference is that while Percentage Envelopes plot two lines at percentage levels above and below a moving average, Bollinger Bands plot two lines or bands at standard deviation levels above and below a moving average.
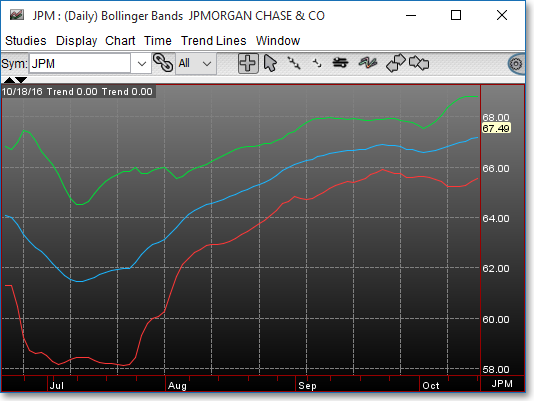
Bollinger Bands are most commonly used with bands plotted two standard deviations from the moving average. The most common moving average used with Bollinger Bands is the 20-day moving average.
Prices tend to stay within the upper and lower bands. The bands automatically self adjust to price changes. Thus, Bollinger Bands help investors determine whether prices are high or low compared to normal volatility. During periods of high volatility, the bands widen, and during periods of low volatility, or consolidation periods, the bands tighten and come closer to the moving average.
Application
John Bollinger has given
many applications to Bollinger Bands:
Sharp price changes tend to occur after consolidation
periods, when volatility lessens. When volatility decreases and the bands
tighten around the moving average, it indicates the possibility of a breakout.
Breakouts will usually move in the direction of the previous trend.
When prices move outside of the bands and stay outside of them, a continuation of the current trend is implied. This is an implication of a change in investor expectations.
Bottoms and tops made outside of the bands followed by bottoms and tops made within the bands signal the possibility of reversals in the trend.
A price move or reversal that originates at one band usually goes all the way to the other band. In other words, the bands act as support and resistance lines. This is helpful in determining price targets.
Chart Settings
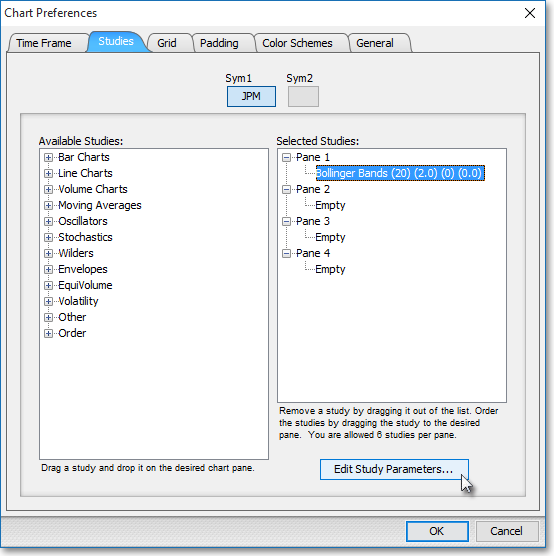
Once the Bollinger Bands technical indicator is selected in a Chart window, you may click with the right mouse button in the body of the Chart window and select "Preference" to access the "Studies" tab.
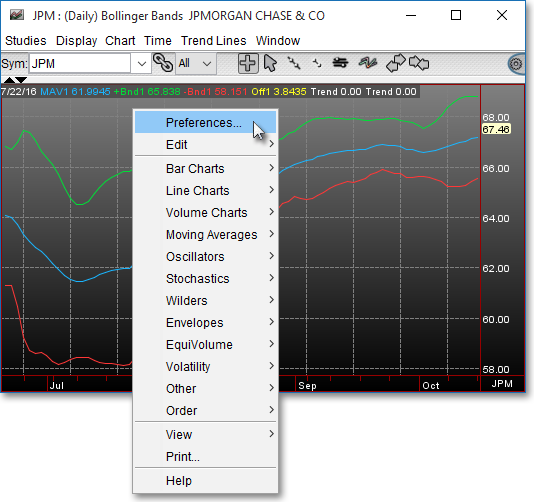
Once there, you may select the study you wish to edit (in this example, "Bollinger Bands (20) (2.0) (0)" is selected), and then click "Edit Study Parameters" in order to specify the moving averages and standard deviation values involved in the calculation and charting of the Bollinger Bands.
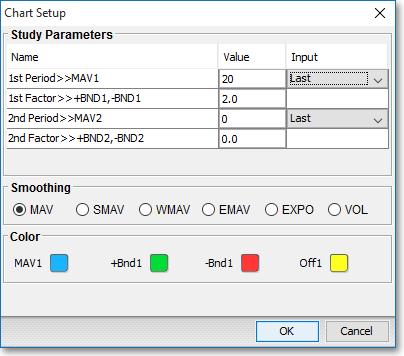
1st Period > > MAV1: This parameter lets you enter the smoothing period for the moving average line. For example, if you are using daily data and you enter the number "20," you will see a 20-day moving average plotted on the chart between the two bands. The default value is the 20-day moving average.
1st Factor > > +BND1, -BND1: This parameter lets you enter the number of standard deviations to be used in the calculation of the trading bands above and below the moving average line. The default value is two standard deviations from the moving average.
2nd Period > > MAV2: This parameter lets you enter the smoothing period for the moving average line of the second Bollinger Band study. This line will not appear in the default setting because it defaults to a value of zero.
2nd Factor > > +BND2, -BND2: This parameter lets you enter the number of standard deviations to be used in the calculation of the second Bollinger Band. This defaults to zero standard deviations, causing only one channel to be drawn on the chart.
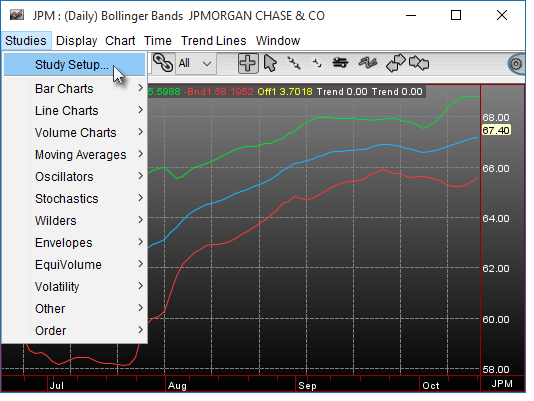
Note: You may also access the "Chart Preferences" window by clicking on "Studies" and selecting "Study Setup..." from the drop-down menu.
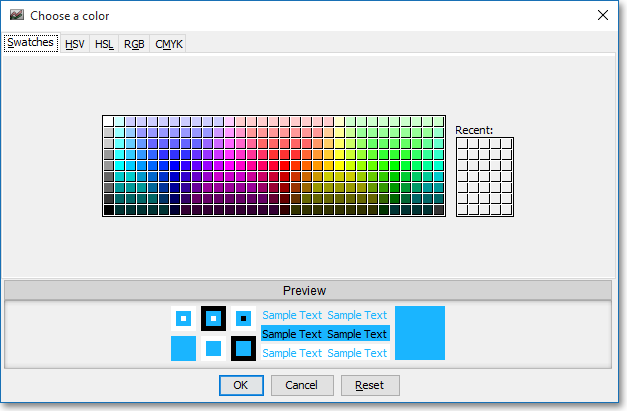
Note: If you wish to change the color of the Chart's lines, simply click on the square to the right of "MAV 1," "+Bnd 1," "-BND1," or "Off1" respectively to cause the "Choose a Color" box to appear. The "Choose a Color" box contains five tabs: "Swatches," "HSV," "HSL," "RGB," and "CMYK." The "Swatches" tab lets you select one of several color "swatches" to replace the existing component color of the selected color scheme. The "HSV," "HSL," "RGB," and "CMYK" tabs let you edit the color of the selected swatch. If at any time you do not like the color of the swatch you selected or you do not like the color changes you have made to the swatch itself, click Reset to return to the existing component color of the selected color scheme. Once you have selected a replacement color, click OK.
Formulas