Envelopes
Introduction
Envelopes are very similar to Bollinger Bands. Envelopes, like Bollinger Bands, are a measure of volatility and consist of two lines above and below a moving average. These lines tend to define the boundaries of a symbol's trading range. Prices tend to bounce off the upper and lower bands.
You may select from five different types of envelopes. The difference between them is the method of plotting the upper and lower bands around the moving average. The following is a description of each Envelope type:
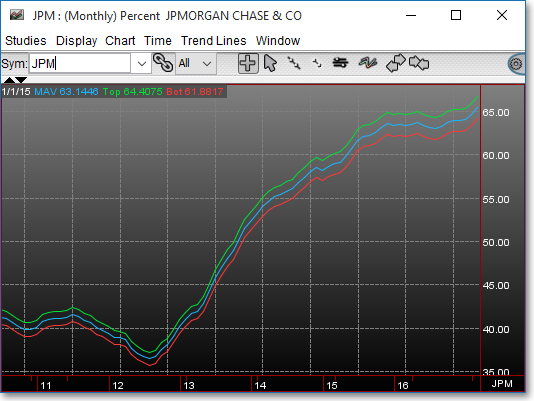
1. Percent: The Percent Envelope plots the upper and lower envelope bands at percentage levels away from the current price. You may enter the percentage
values if you wish.
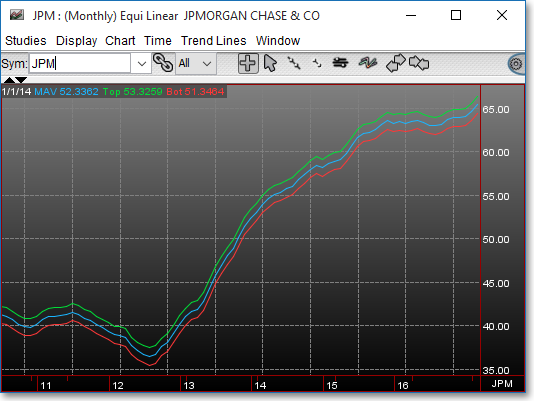
2. Equi Linear: The Equi Linear Envelope displays the bands based on the average of the sum of all the data points multiplied by a percentage factor. You may
change the percentage factor if you wish.
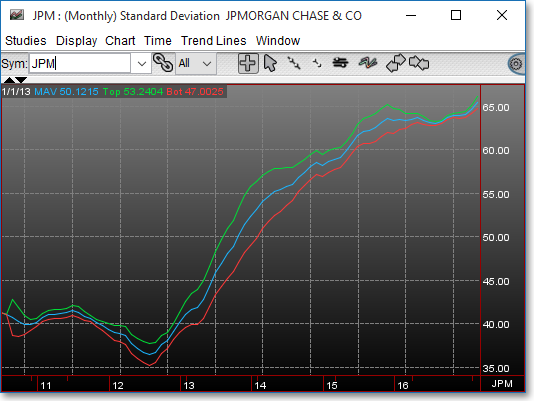
3. Standard Deviation: The Standard Deviation Envelope plots the envelope bands at standard deviation levels above and below the moving average. This
Envelope isbasically the same as Bollinger Bands. You may specify the number of standard deviations that the bands are to be drawn from the mean. The most popular is two standard deviations from the mean.
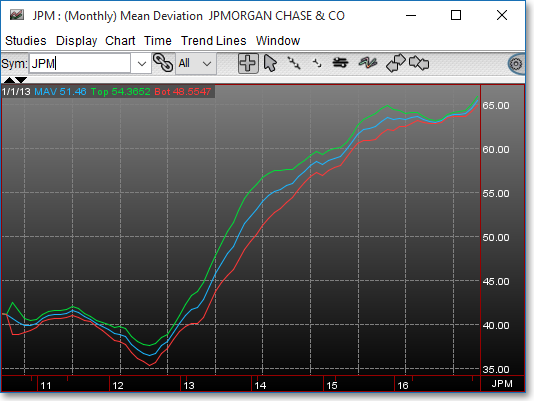
4. Mean Deviation: The Mean Deviation Envelope is very similar to the Standard Deviation Envelope. The difference between the two is due to how each is
calculated. The Standard Deviation Envelope squares each deviation from the mean, and the Mean Deviation Envelope takes the absolute value of each deviation from the mean. As with the Standard Deviation Envelope, you may specify the number of standard deviations that the bands are to be drawn from the mean.
5. Average Change: The Average Change Envelope lets you calculate a moving average on the envelope. This envelope takes the average of the sum of a
specified numberof days and multiplies it by a percentage value. You may change the moving average period and the percentage factor if you wish.
Application
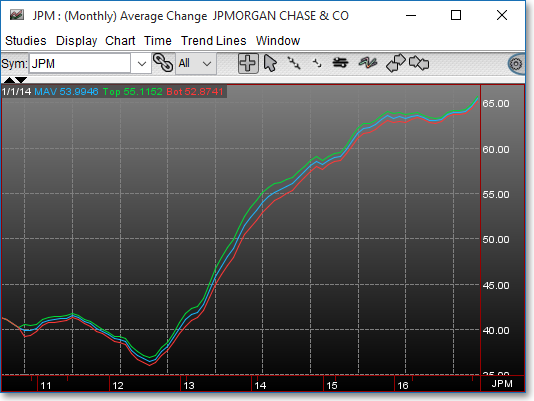
Because prices tend to stay within the upper and lower Envelope bands, bullish indications are given when prices reach the lower band, and bearish indications are given when prices reach the upper band. The upper and lower bands act as support and resistance levels.
Chart Settings
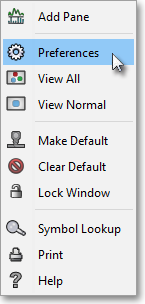
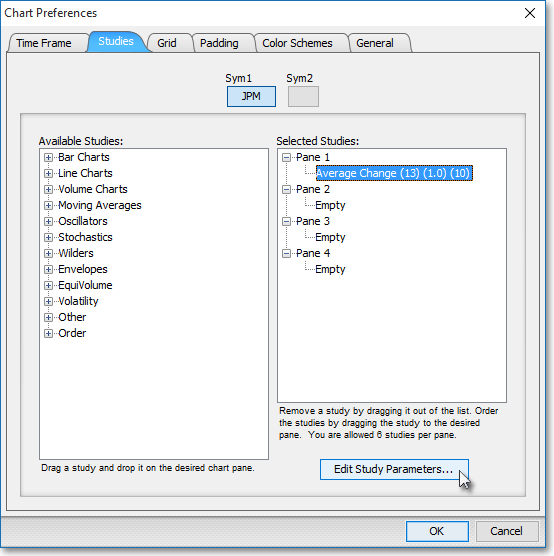
Once the Envelope technical indicator is selected in a Chart window, you may click with the right mouse button in the body of the Chart window and select "Preference" to access the "Studies" tab. Once there, you may select the study you wish to edit (in this example, "Average Change (13) (1.0) (10)" is selected), and then click "Edit Study Parameters" in order to enter the number of intervals to be used in the study.
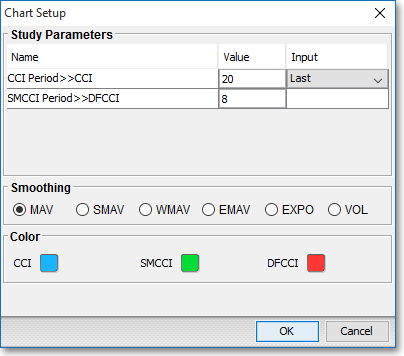
Once there, you may select the moving average period, the Percentage Factor, and in some envelopes, the Envelope Period.
Percent and Equilinear Envelopes:
MAV Period > > MAV: This parameter lets you enter the moving average period that will be used to chart the envelope. For example, for a 20-day moving average, you would type the number "20" in this setting.
Factor: This is the
percentage of the moving average that will be used to draw the top and
bottom envelope bands. For example, if you wish the bands to be drawn
25 percent out from the moving average, you would type "25" for this parameter.
Standard Deviation, Mean Deviation, and Average Change Envelopes:
MAV Period > > MAV: This parameter lets you enter the moving average period that will be used to chart the envelope. For example, for a 20-day moving average, you would type the number "20" in this setting.
Factor: This is the number of standard deviations or mean deviations from the moving average used to draw the top and bottom envelope bands. For example, if you wish the bands to be drawn out two standard deviations from the moving average, you would type "2" for this parameter.
Envelope Period: This is the parameter or number of periods that will be used to calculate the moving average of the mean or standard deviations. In the case of the Average Change Envelope, this parameter determines the number of periods that will be used in the smoothed moving average calculation.
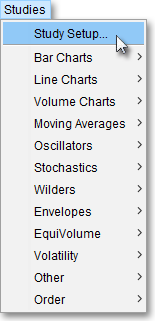
Note: You may also access the "Chart Setup" window by clicking on "Studies" and selecting "Study Setup..." from the dropdown menu.
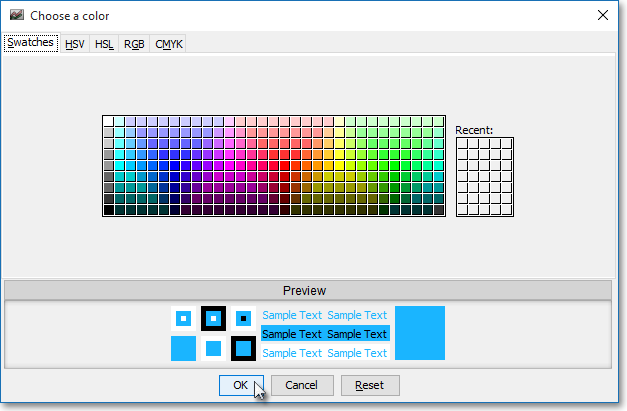
Note: If you wish to change the color of the Chart's lines, simply click on the square to the right of "MAV," "Top," or "Bot" respectively to cause the "Choose a Color" box to appear. The "Choose a Color" box contains five tabs: "Swatches," "HSV," "HSL," "RGB," and "CMYK." The "Swatches" tab lets you select one of several color "swatches" to replace the existing component color of the selected color scheme. The "HSV," "HSL," "RGB," and "CMYK" tabs let you edit the color of the selected swatch. If at any time you do not like the color of the swatch you selected or you do not like the color changes you have made to the swatch itself, click Reset to return to the existing component color of the selected color scheme. Once you have selected a replacement color, click OK.
Formulas
Percent:
(Pi) * (F)
Where:
Pi
= Current Price
F
= Percentage Factor
Equilinear:
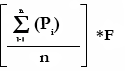
Where:
n = All Data Points
Pi = Current Price
F = Percentage Factor
Standard Deviation:
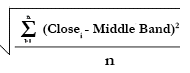
Where:
n = Number of Intervals
Closei = Last
or Current Price
Mean
Deviation:
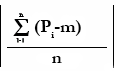
Where:
n = Number of Intervals
Pi = Current Price
m = Moving Average
Average Change:
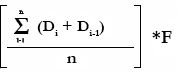
Where:
Di = |Current
Price - Previous Price|
DI-1= |Previous Price - 2nd Previous Price|
n = Number of Intervals
F = Percentage Factor