Directional Movement
Introduction
The Directional Movement system was developed by Welles Wilder. It is a trend-following system that helps investors determine when a symbol is in an up or a downtrend.
The Directional Movement indicator consists of three lines. The first line is the +DI (Directional Indicator), and the second line is the -DI. These lines are drawn by plotting the two indicators on top of each other or by subtracting the +DI from the -DI. The third line is the ADX (Average Directional Movement Index). The ADX line is a moving average of the Directional Movement Index.
Application
When using the Directional Movement system, Wilder suggests that investors consider buying when the +DI rises above the -DI and consider selling short when the +DI falls below the -DI. In order to reduce the number of trades and prevent whipsaws, Wilder uses the "extreme point rule." This rule requires that on the day the +DI and -DI lines cross, you note the extreme point. When the +DI crosses above the -DI, the extreme point is the high price of the day. When the +DI falls below the -DI, the extreme point is the low price of that day.
Once the extreme point has been noted, Wilder suggests using the extreme point as a confirming element before implementing the trade. For example, once the +DI line crosses above the -DI, the investor should note the "extreme point," or high of the day. According to Wilder, the investor should then wait until the symbol has traded above that point before implementing the trade.
Another item that Wilder noticed is that the turning point of a trend often occurred with the first down turn of the ADX line, after it had already crossed both the +DI and -DI lines. Wilder also noticed that when the ADX line fell below both the +DI and -DI lines it was time to stop using the trend-following system and cease trading for a time. This infers that the symbol has moved into a time of consolidation, or a sideways trend.
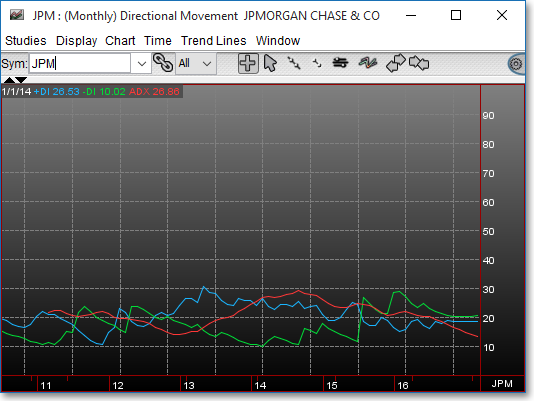
Chart Settings
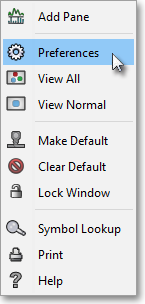
Once the Directional Movement technical indicator is selected in a Chart window, you may click with the right mouse button in the body of the Chart window and select "Preferences" to access the "Studies" tab. Once there, you may select the study you wish to edit (in this example, "Directional Movement (14)" is selected), and then click "Edit Study Parameters" in order to enter the number of intervals to be used in the study.
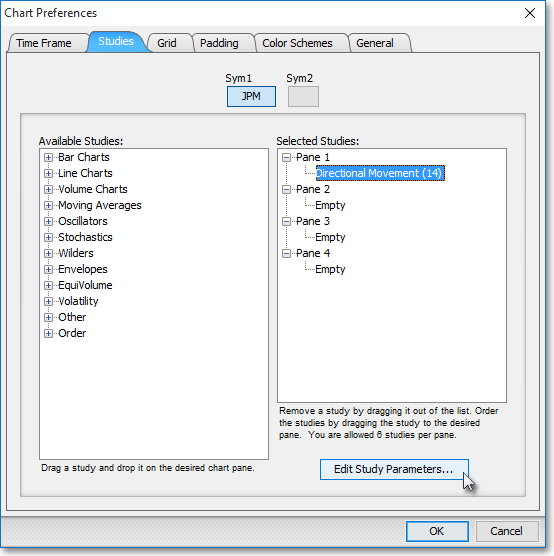
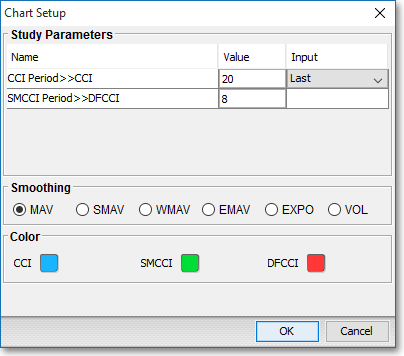
DIR Period > > +DI, -DI, ADX: This parameter lets you enter the number of intervals to be used in the calculation.
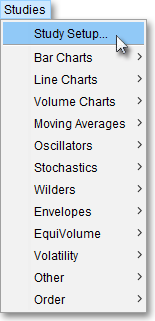
Note: You may also access the "Chart Setup" window by clicking on "Studies" and selecting "Study Setup..." from the drop-down menu.
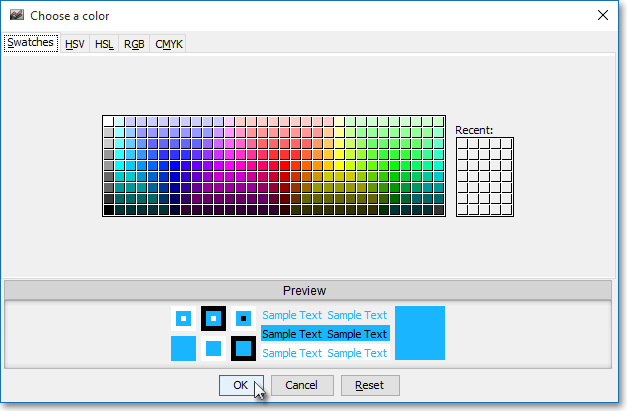
Note: If you wish to change the color of the Chart's lines, simply click on the square to the right of "+DI," "-DI," or "ADX" respectively to cause the "Choose a Color" box to appear. The "Choose a Color" box contains five tabs: "Swatches," "HSV," "HSL," "RGB," and "CMYK." The "Swatches" tab lets you select one of several color "swatches" to replace the existing component color of the selected color scheme. The "HSV," "HSL," "RGB," and "CMYK" tabs let you edit the color of the selected swatch. If at any time you do not like the color of the swatch you selected or you do not like the color changes you have made to the swatch itself, click Reset to return to the existing component color of the selected color scheme. Once you have selected a replacement color, click OK.
Formula
ADX = The moving average for the Directional Movement Index
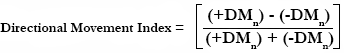
Where:
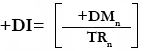
+DMn = Difference of today and yesterday's high for n amount of
days
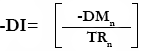
–DMn = Difference of today and yesterday's low for n amount
of days
*If today's range is outside of yesterday's range, the larger of the +DM and -DM will be used for the calculation. If today's range is inside of yesterday's range, the value will be zero.
TR = The largest of the following:
Today's high - Today's low
Today's high - Yesterday's close
Today's low - Yesterday's close
Note: The negative sign (-) on the -DM is an indication of downward movement; the value is always positive.