Commodity Channel Index Difference
Introduction
The Commodity Channel Index Difference (CCI Difference) displays the difference of two CCI lines. The first line is a regular CCI line. The second line is a smoothed version of the first line. The second line is subtracted from the first to reach the Difference CCI (DFCCI) line displayed on the chart.
Application
When using the CCI Difference, investors should look for trends in the indicator. For example, when the indicator bottoms out on the negative side and then begins to reverse, a bullish indication is the result. When the indicator reaches its peak and then begins to fall, a bearish indication is the result.
The trend is the most important feature of this indicator, not the value. Look for tops and bottoms of the indicator, since this is when it is most reliable.
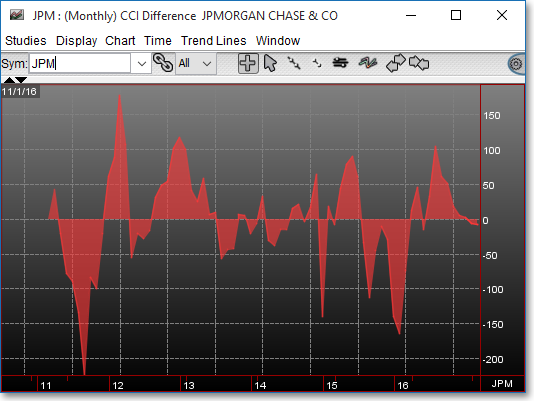
Chart Settings
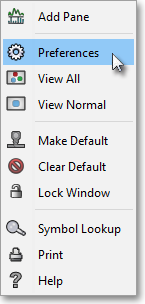
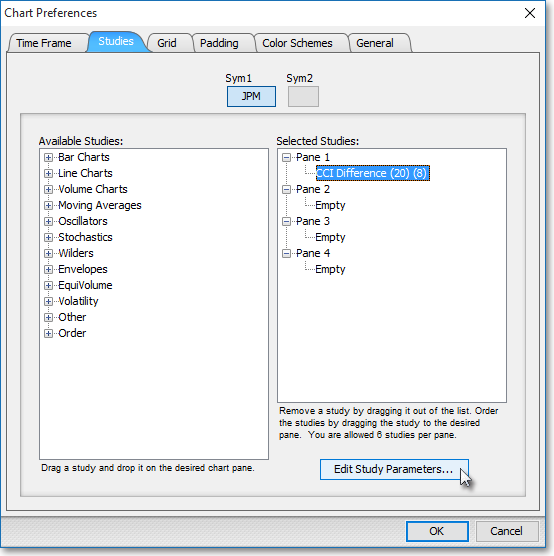
Once the CCI Difference technical indicator is selected in a Chart window, you may click with the right mouse button in the body of the Chart window and select "Preferences" to access the "Studies" tab. Once there, you may select the study you wish to edit (in this example, "CCI Difference (20) (8)" is selected), and then click "Edit Study Parameters" in order to specify the number of periods as well as the type of price data that will be used in the CCI Difference calculation.
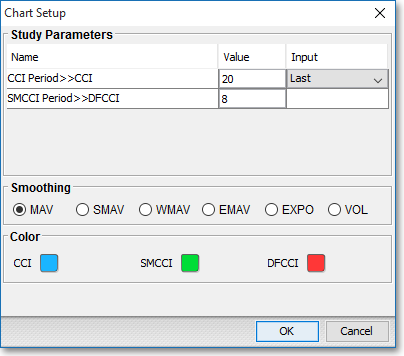
CCI Period > > CCI: This parameter lets you enter the number of periods to be used in the CCI calculation. The number of periods entered in the "Value" field will be used for the moving average and the mean deviation calculations. Here you may also specify the type of price data to be used in the calculation.
SMCCI Period > > DFCCI: This parameter lets you enter a moving average period to calculate the smoothed version of the CCI Period. The difference of the CCI and this line will result in the DFCCI line that will be displayed in the chart.
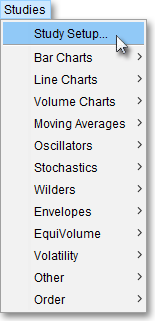
Note: You may also access the "Chart Setup" window by clicking on "Studies" and selecting "Study Setup..." from the drop-down menu.
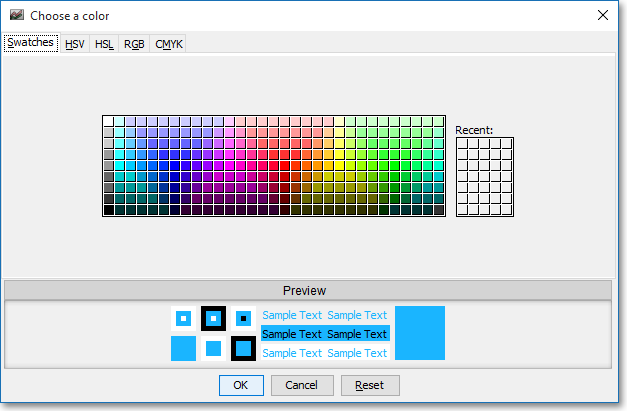
Note: If you wish to change the color of the Chart's lines, simply click on the square to the right of "CCI," "SMCCI," or "DFCCI" respectively to cause the "Choose a Color" box to appear. The "Choose a Color" box contains five tabs: "Swatches," "HSV," "HSL," "RGB," and "CMYK." The "Swatches" tab lets you select one of several color "swatches" to replace the existing component color of the selected color scheme. The "HSV," "HSL," "RGB," and "CMYK" tabs let you edit the color of the selected swatch. If at any time you do not like the color of the swatch you selected or you do not like the color changes you have made to the swatch itself, click Reset to return to the existing component color of the selected color scheme. Once you have selected a replacement color, click OK.
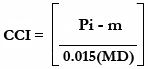
Formula
CCI Difference = (CCI - SCCI)
Where:
Pi = Current Price
m = Moving Average:
MD
= Mean Deviation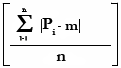
SCCI
=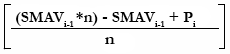
SMAVi
= Current SMAV Value
n
= Number of Intervals
Pi
= Current Price