Chart Window Introduction
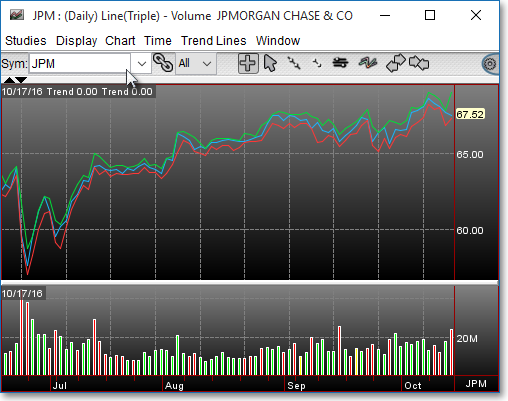
Charting is an essential component of any technical analysis program. Neovest's charting flexibility lets you input and manipulate symbol data quickly in a variety of colorful and feature-rich displays. Each Neovest chart is updated on a real-time, tick-by-tick basis, which provides the ability to view precise market movements as they occur.
Whether you wish to view tick, intraday, daily, weekly, or monthly symbol data, Neovest provides a variety of adjustable parameters, customizable technical indicators, detailed symbol overlays, multiple display panes, and unique data manipulation tools to enable you to make informed trading decisions.
Neovest's intraday charts may be loaded with any time frame of symbol data, or you may select one of Neovest's predetermined intraday time frames that range from one to 90 minutes. Neovest also provides tick, daily, weekly, and monthly charts that may be loaded with as much historical symbol data as you require to effectively determine trading strategies.
Neovest's database of historical data contains up to one year of intraday data and more than fifteen years of daily data. To ensure tick-by-tick accuracy, Neovest utilizes automatic algorithms to scan its data, correct bad ticks, and filter invalid trades, including exchange-transmitted corrections.
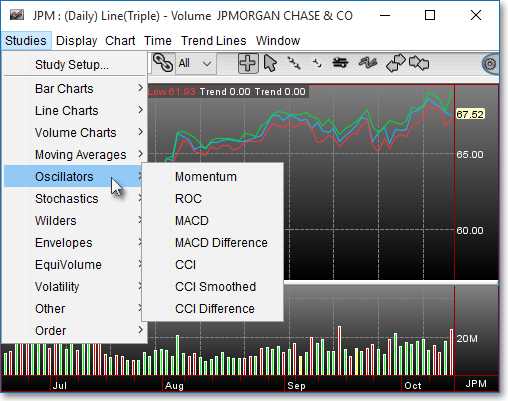
Neovest provides over 35 technical indicators and charting tools, including extended and Fibonacci trend lines, that may be used to pinpoint the very best times to trade individual symbols. Furthermore, Neovest lets you edit the parameters for each of its technical indicators and charting tools.
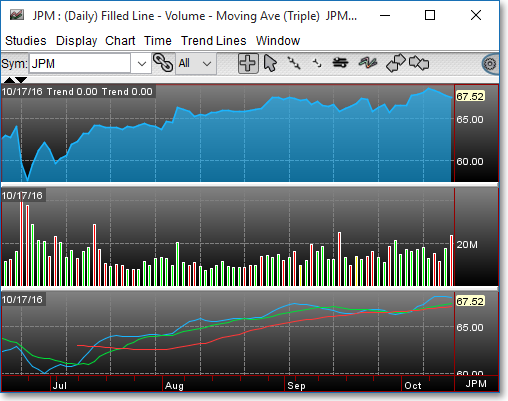
Additionally, each Neovest Chart window may be divided into multiple panes, which lets you clearly see more than one technical indicator or charting tool applied separately to the same symbol in an open Chart window. Neovest also lets you overlay two separate symbols in a Chart window, which lets you compare the current and historical trading activity of two different symbols over the course of the same time period.
If you wish to utilize trend lines in connection with Neovest Chart data, Neovest lets you draw extended, truncated, and Fibonacci trend lines in an open Chart window or Chart pane. Trend lines are designed to be drawn on symbol data within charts to indicate where trends have occurred and where trends are likely to occur again. Thus, trend lines may be used to pinpoint the very best times to trade individual symbols.
Neovest also lets you adjust a drawn extended, truncated, and Fibonacci trend line to the high, low, open, and close prices of Chart data in an open Chart window or Chart pane. Using Neovest's trend line features, you may also reposition either end of a drawn trend line, move an entire drawn trend line, and remove all types of drawn trend lines at once with the use of a simple hot key.
Neovest's Help menu provides complete instructions on how you may load a symbol in an open Chart window, select different time frames, load technical indicators, and draw charting tools. Instructions are also provided that explain how you may divide a Chart window into multiple panes, change the colors of a Chart window, link and unlink a Chart window to and from other open Neovest windows, save a customized Chart window as the default, and save an open Chart window in a Neovest layout.