On Balance Volume
Introduction
On Balance Volume is a momentum indicator that links together volume and price changes. It is similar to the Accumulation Distribution indicator. It was developed by Joe Granville and presented in his book New Strategy of Daily Stock Market Timing for Maximum Profits.
On Balance Volume allows investors to monitor the inflow and outflow of volume on a specific symbol. It is a cumulative total of volume. Volume is added to the cumulative total on up days (when the symbol's price increases) and subtracted from the cumulative total on down days (when the symbol's price decreases). For this reason, the trend is what is important, not the value of On Balance Volume. Price is used only to determine up days from down days. When the price of a symbol closes above the previous day's close, all of the volume is considered up volume. When the price closes below the previous day's close, all of the volume is considered down volume.
Application
On Balance Volume is based on the assumption that On Balance Volume changes precede price changes. Thus, a bullish indication is given when an upside breakout of On Balance Volume occurs, and a bearish indication is given when a downside breakout occurs.
On Balance Volume can take on three trends: an uptrend, a downtrend, or a sideways trend. An uptrend occurs when each new peak is higher than the previous peak and when each new trough is higher than the previous trough. A downtrend is the exact opposite: Each new peak is lower than the previous, and each new trough is lower than the previous. A sideways trend occurs when the On Balance Volume is not making successive highs or lows. On Balance Volume is not a good indicator to use in a sideways trend.
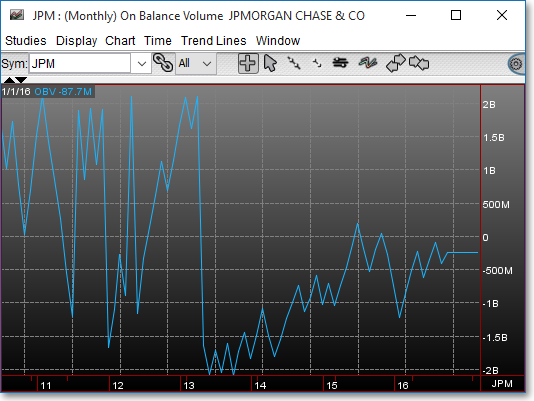
Chart Settings
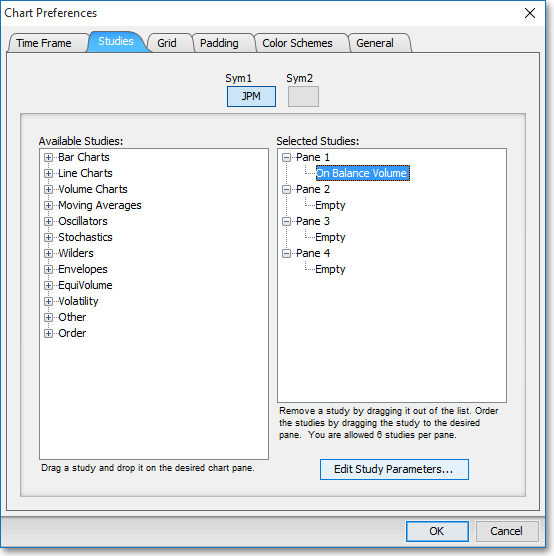
Once the On Balance Volume technical indicator is selected in a Chart window, you may click with the right mouse button in the body of the Chart window and select "Preferences" to access the "Studies" tab. Once there, you may select the study you wish to edit (in this example, "On Balance Volume" is selected), and then click "Edit Study Parameters" in order to specify the type of input data you wish to use in the calculation of the On Balance Volume.
On Balance Volume > > OBV: This parameter lets you choose the type of input data to be used in the calculation of the On Balance Volume. You may choose Last, Open, High, or Low as the input data to be used in the calculation.
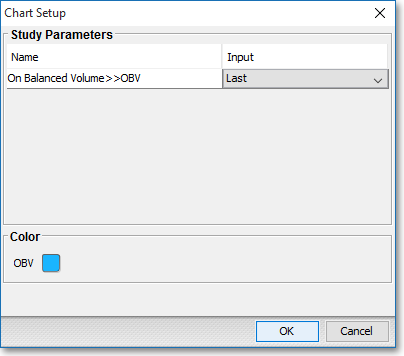
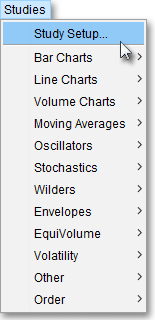
Note: You may also access the "Chart Setup" window by clicking on "Studies" and selecting "Study Setup..." from the drop-down menu.
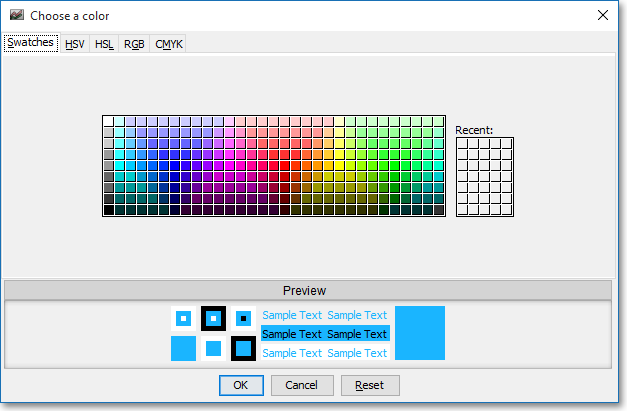
Note: If you wish to change the color of the Chart's lines, simply click on the square to the right of "OBV" respectively to cause the "Choose a Color" box to appear. The "Choose a Color" box contains five tabs: "Swatches," "HSV," "HSL," "RGB," and "CMYK." The "Swatches" tab lets you select one of several color "swatches" to replace the existing component color of the selected color scheme. The "HSV," "HSL," "RGB," and "CMYK" tabs let you edit the color of the selected swatch. If at any time you do not like the color of the swatch you selected or you do not like the color changes you have made to the swatch itself, click Reset to return to the existing component color of the selected color scheme. Once you have selected a replacement color, click OK.
Formula
Volumei+ OBVi-1= Pi > Pi-1
Volumei– OBVi-1= Pi < Pi-1
Where:
Volumei = Current Day's Volume
OBVi-1
= Previous On Balance Volume
Pi =
Current Price
Pi-1
= Previous Price