MACD
Introduction
MACD (Moving Average Convergence/Divergence) displays two lines on a chart. The first line is a standard oscillator (the difference of two moving averages). The second line is a smoothed version of the first line. You may define the amount of smoothing. It is recommended by Gerald Appel, creator of the MACD, that you use the Exponential Moving Average (EMAV) smooth type. He also recommends a 12-day and a 26-day Exponential Moving Average on the day's closing prices. The signal line is an exponential moving average of the MACD line. Appel recommends a nine-day EMAV for the signal line.
The MACD was written for stocks and stock indices; however, it could conceivably be used for commodities. The study has been found to be most effective in wide swinging markets where instruments have a considerable trend.
Application
The most popular uses of the MACD indicator involve crossovers of the moving average lines that make up the MACD. One of the most basic and popular trading rules for the MACD consists of buying as the MACD crosses above the signal line and selling as the MACD drops below the signal line. Another common strategy is to buy and sell as the MACD crosses above and below the zero line.
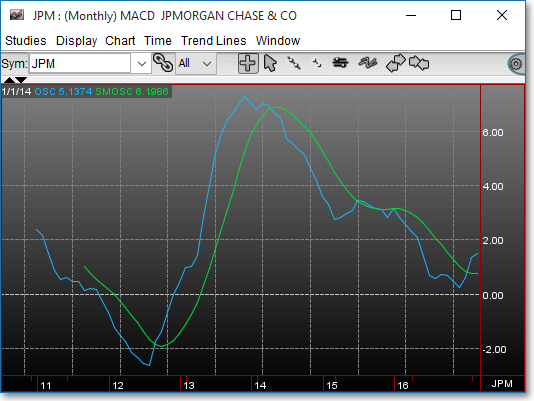
Chart Settings
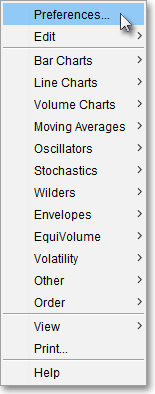
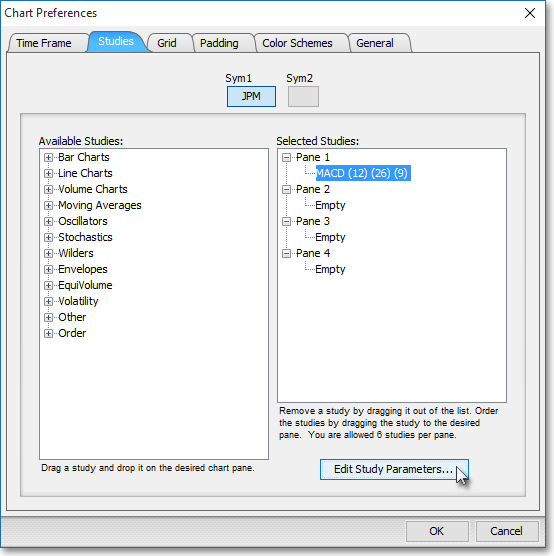
Once the MACD technical indicator is selected in a Chart window, you may click with the right mouse button in the body of the Chart window and select "Preferences" to access the "Studies" tab. Once there, you may select the study you wish to edit (in this example, "MACD (12) (26) (9)" is selected), and then click "Edit Study Parameters" in order to select the moving average period and price data used in the MACD calculation.
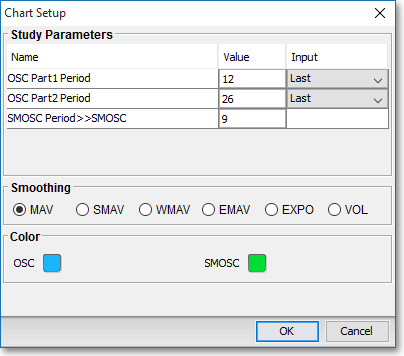
OSC Part1 Period: This parameter lets you define the moving average period (Value) and the type of price information (input data) to be used for the first moving average line of the difference calculation.
OSC Part2 Period > > OSC: This parameter lets you define the moving average period (Value) and the type of price information (input data) for the second moving average line in the difference calculation. The difference of the first moving average line (OSC Part1) and the second moving average line (OSC Part2) will result in a Difference Oscillator (OSC) that will appear on the chart.
SMOSC Period > > SMOSC: This parameter lets you assign a moving average period (Value) to the first oscillator line (SMOS1). If you do not wish any smoothing for the line, enter "1."
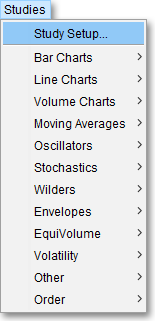
Note: You may also access the "Chart Setup" window by clicking on "Studies" and selecting "Study Setup..." from the drop-down menu.
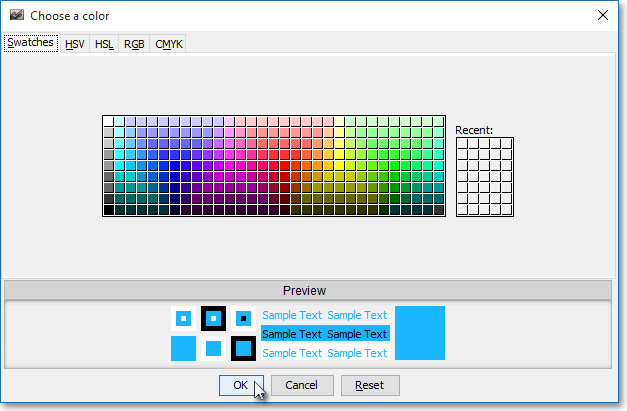
Note: If you wish to change the color of the Chart's lines, simply click on the square to the right of "OSC" or "SMOSC" respectively to cause the "Choose a Color" box to appear. The "Choose a Color" box contains five tabs: "Swatches," "HSV," "HSL," "RGB," and "CMYK." The "Swatches" tab lets you select one of several color "swatches" to replace the existing component color of the selected color scheme. The "HSV," "HSL," "RGB," and "CMYK" tabs let you edit the color of the selected swatch. If at any time you do not like the color of the swatch you selected or you do not like the color changes you have made to the swatch itself, click Reset to return to the existing component color of the selected color scheme. Once you have selected a replacement color, click OK.
Formula
Standard Oscillator:
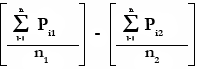
Where:
Pi1 = Current Price of 1st Moving Average
n1 = Number of Intervals on 1st Moving Average
Pi2 = Current Price of 2nd Moving Average
n2 = Number of Intervals on 2nd Moving Average
Signal Line:
*This is the Formula of the recommended Signal Line:
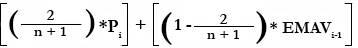
Where:
n = Number of Intervals
Pi = Current Price
EMAV = Current EMAV Value