Time Frame Tab
Features in the "Time Frame" tab in Neovest's "Chart Preferences" box let you (1) change the time frame of the symbol data and (2) change the amount of historical symbol data in a Neovest Chart window.
Neovest's charting flexibility lets you quickly input and manipulate symbol data in various types of charts. Whether you wish to view tick, intraday, daily, weekly, or monthly symbol data, Neovest provides a variety of Chart window display options, indicators, and tools to assist you in making trading decisions.
Neovest's intraday charts may be loaded with any time frame of symbol data you wish, or you may select one of Neovest's predetermined intraday time frames that range from 1 to 90 minutes. Neovest also provides tick, daily, weekly, and monthly charts that may be loaded with as much historical symbol data as you require to effectively determine trading strategies.
The following instructions explain how you may (1) change the time frame of the symbol data and (2) change the amount of historical symbol data in an open Neovest Chart window:
To change the time frame of the symbol data in an open Chart window:
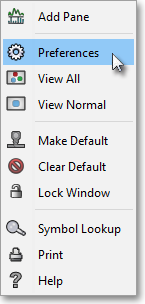
With a Chart window open on your screen, click the gear icon, located on the far-right of the toolbar.

Click the "Preferences" icon on the drop-down menu that appears.
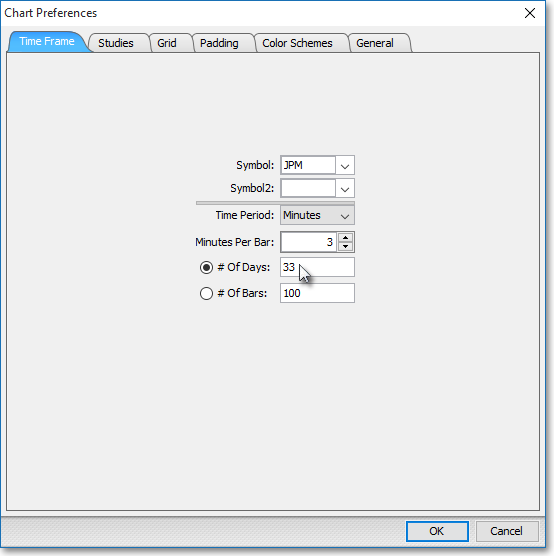
Once the "Chart Preferences" box appears, select the "Time Frame" tab.
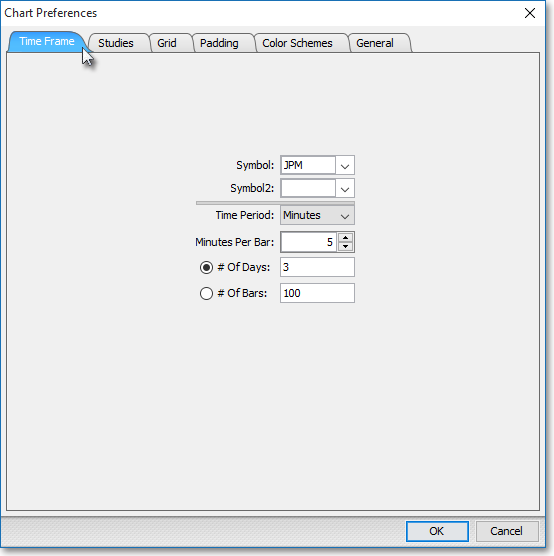
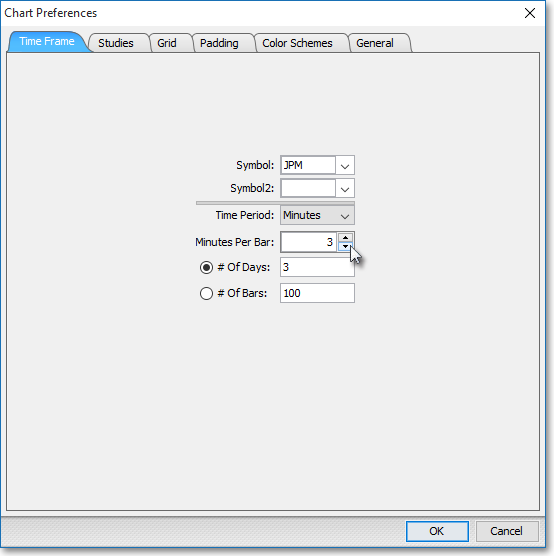
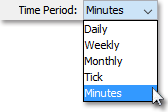
Click on the "Time Period" down arrow, and select the time frame you wish. (For example, if you wish to load the open Chart window with three-minute intraday symbol data, select "Minutes" in the "Time Period" drop down menu and type "3" into the "Minutes Per Bar" field.)
Once you have specified the time frame you wish, click OK.

To change the amount of historical symbol data in an open Chart window:
With a Chart window open on your screen, click the gear icon, located on the far-right of the toolbar.
Click the "Preferences" icon on the drop-down menu that appears.
Once the "Chart Preferences" box appears, select the "Time Frame" tab.
Note: If you select "Minutes" or one of the preset intraday time frames (i.e., "1," "3," "5," etc.) as the "Time Period," then two additional "# Of ..." features will appear in the "Time Frame" tab. The following instructions explain the two additional features.
Click on "# Of Days" if you wish the open Chart window to display the specified number of days of data. Once you select this feature, you may highlight the current value and enter a different number to change the number of days.
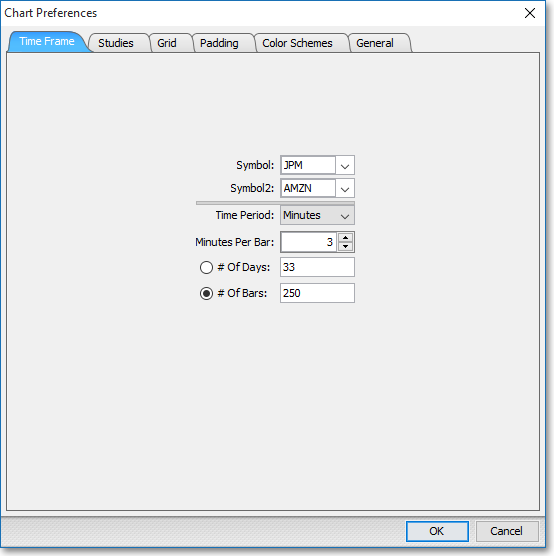
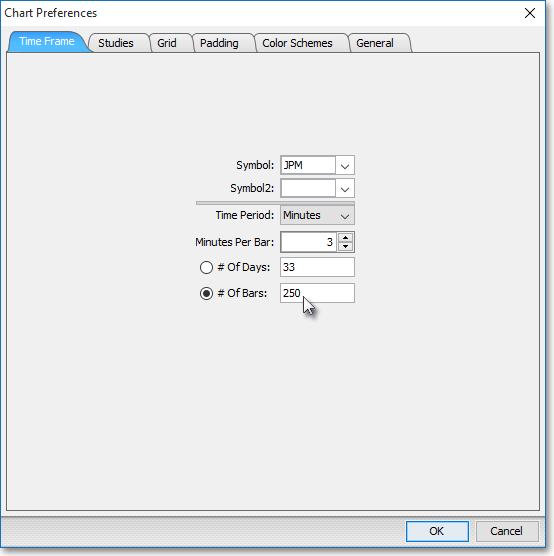
Click on "# Of Bars" if you wish the open Chart window to display the specified number of bars of data (Option available for only the "Minutes" feature under "Time Period"). Once you select this feature, you may highlight the current value and enter a different number to change the number of bars. (For example, if you wish to load the open Chart window with 250 one-minute intraday bars of symbol data, then replace the current "# Of Bars" value with "250.")
Note: This feature will automatically change to "# Of Ticks" if you select "Tick" as the "Time Period" for the symbol data.
Once you have specified the amount of historical symbol data you wish, click OK.
Note: If you wish to compare the current and historical trading activity of two different symbols over the course of the same time period in the open Chart window, you may enter separate symbols in the "Symbol" and "Symbol2" fields in this tab, and click OK.