Accumulation Distribution
Introduction
The Accumulation Distribution indicator is a momentum indicator that links together price and volume changes. It is based on the assumption that the more volume that accompanies a price, the more significant the move.
When the Accumulation Distribution indicator moves up, it shows that the symbol is being accumulated or bought. When the indicator moves down, it shows that the symbol is being distributed or sold.
Application
Divergences between the Accumulation Distribution and a symbol's price are a good signal of a reversal. When prices are making new highs but the Accumulation Distribution is making new lows, prices will usually change to confirm the Accumulation Distribution's trend.
Accumulation Distribution is also a good indicator of continuations of current trends. For example, when a symbol is in a strong upward trend and the Accumulation Distribution is also in a strong upward trend, it is a good sign that the trend will continue. The same is true if the symbol and its Accumulation Distribution are in a strong downward trend. For this reason it is useful to use the Accumulation Distribution indicator with a trend-following indicator.
Chart Settings
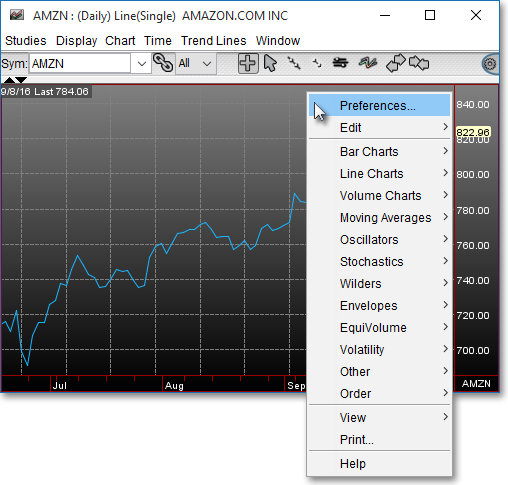
Once the Accumulation Distribution technical indicator is selected in a Chart window, you may click with the right mouse button in the body of the Chart window and select "Preferences" to access the "Studies" tab.
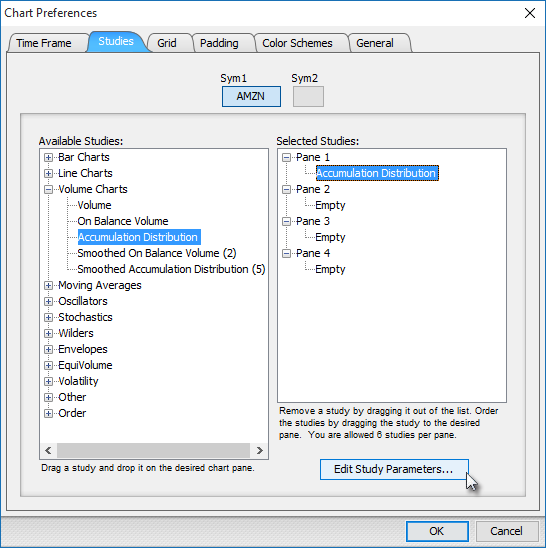
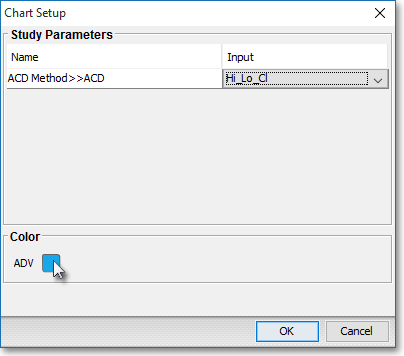
Once there, you may select the study you wish to edit (in this example, "Accumulation Distribution" is selected), and then click "Edit Study Parameters" in order to select one of three different methods for calculating the Accumulation Distribution.
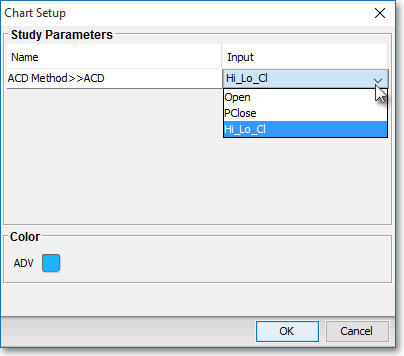
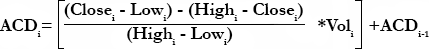
ACD Method > > ACD: Chaikin's Mid-Point method (Hi_Lo_Cl)
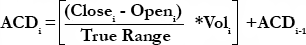
ACD Method > > ACD: Williams' Open to Close method (Open)
ACD Method > > ACD: Granville's Previous Close method (PClose)
Formulas
Chaikin's Midpoint Method (High-Low-Close):
Williams' Open to Close Method (Open):
Granville's Previous Close Method (PrevClose):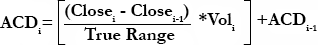
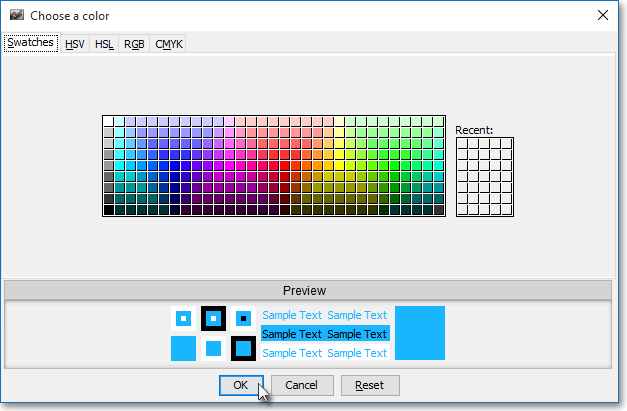
Note: If you wish to change the color of the Chart's lines, simply click on the square to the right of "ADV" to cause the "Choose a Color" box to appear. The "Choose a Color" box contains five tabs: "Swatches," "HSV," "HSL," "RGB," and "CMYK." The "Swatches" tab lets you select one of several color "swatches" to replace the existing component color of the selected color scheme. The "HSV," "HSL," "RGB," and "CMYK" tabs let you edit the color of the selected swatch. If at any time you do not like the color of the swatch you selected or you do not like the color changes you have made to the swatch itself, click Reset to return to the existing component color of the selected color scheme. Once you have selected a replacement color, click OK.
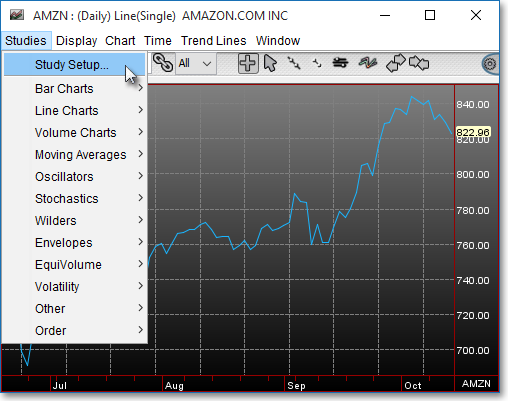
Note: You may also access the "Chart Setup" window by clicking on "Studies" and selecting "Study Setup..." from the drop-down menu.