Relative Strength Index
Introduction
The Relative Strength Index (RSI) is a popular oscillator that was developed by Welles Wilder. In-depth interpretations and calculations are available in Wilder's book, New Concepts in Technical Trading Systems.
The RSI is an indicator that displays the percentage of up and down price movement regarding a single symbol, giving the investor a measure of the internal strength of the symbol.
Application
The RSI has many uses. In Welles Wilder's book, he discusses five uses of the RSI to analyze commodity charts. These methods may also be applied to other securities as well.
1. Tops and Bottoms: A top is indicated when the RSI goes above 70, and the bottom is indicated when the RSI goes below 30. The RSI will usually top or bottom
out before the price chart will, thus giving indication of an imminent reversal.
2. Chart Formations: The RSI will show charting patterns that may not be visible on a corresponding bar chart (i.e., head & shoulders, triangles, rounding tops and
bottoms, etc.).
3. Failure Swings: Failure Swings is a pattern where the most recent high or low in an RSI study fails to exceed the previous high or low. Patterns such as these
that occur above 70 or below 30 on the RSI are strong indicators of an imminent reversal.
4. Support & Resistance: Support & Resistance areas show up many times on the RSI before becoming apparent on a bar chart.
5. Divergences: A Divergence between price action and the RSI is a very strong indicator of a reversal. Price action will usually reverse to imitate the RSI's trend.
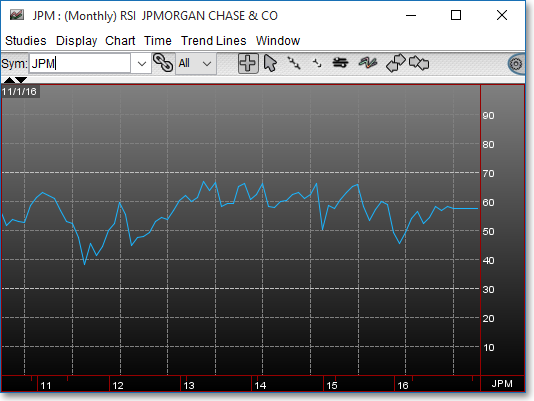
Chart Settings
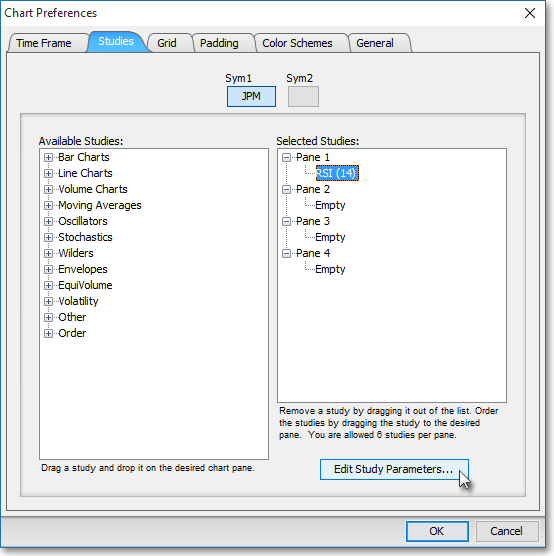
Once the RSI technical indicator is selected in a Chart window, you may click with the right mouse button in the body of the Chart window and select "Preferences" to access access the "Studies" tab. Once there, you may select the study you wish to edit (in this example, "RSI (14)" is selected), and then click "Edit Study Parameters" in order to enter the period and input data used in the calculation.
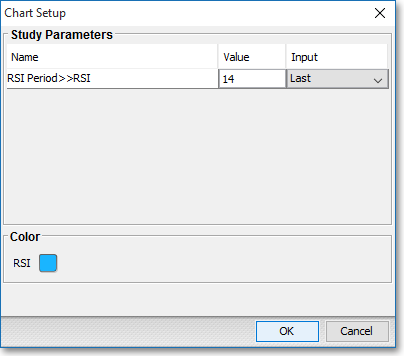
RSI Period > > RSI: This parameter lets you enter the number of intervals and the type of price information to be used in the RSI calculation. You may choose Last, Open, High, or Low as the input data to be used in the calculation.
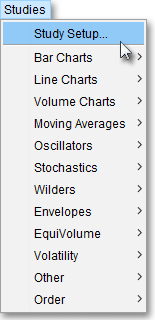
Note: You may also access the "Chart Setup" window by clicking on "Studies" and selecting "Study Setup..." from the drop-down menu.
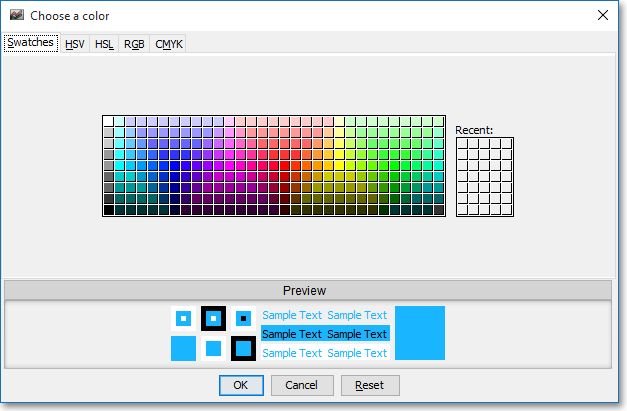
Note: If you wish to change the color of the Chart's lines, simply click on the square to the right of "RSI" respectively to cause the "Choose a Color" box to appear. The "Choose a Color" box contains five tabs: "Swatches," "HSV," "HSL," "RGB," and "CMYK." The "Swatches" tab lets you select one of several color "swatches" to replace the existing component color of the selected color scheme. The "HSV," "HSL," "RGB," and "CMYK" tabs let you edit the color of the selected swatch. If at any time you do not like the color of the swatch you selected or you do not like the color changes you have made to the swatch itself, click Reset to return to the existing component color of the selected color scheme. Once you have selected a replacement color, click OK.
Formula
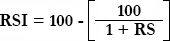
Where:
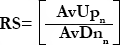
AvUpn = Average of "n" days closing up, or higher than
the previous close
AvDnn = Average of "n" days closing
down, or below the previous close