MACD Difference
Introduction
The MACD (Moving Average Convergence/Divergence) Difference, developed by Gerald Appel, shows the relationship between two moving averages. This indicator was first written for stocks and stock indices but may also be used with commodities. This study has been found to be most effective in wide swinging markets where instruments have a considerable trend.
The first or MACD line is the difference between two moving averages and, according to Appel, is most effective with a 12-day and a 26-day exponential moving average (EMAV). The second or "signal" line, according to Appel, should be set so that it will plot a nine-day exponential moving average of the first line. The MACD Difference is simply the difference between the first and second lines.
Application
The most popular use of the MACD Difference involves the overbought and oversold indication of an instrument. Extreme high or low values indicate that the shorter moving average, or MACD line, is dramatically diverging from the longer moving average, or the signal line. This indicates that an instrument may be overextending itself and will soon return to more realistic levels.
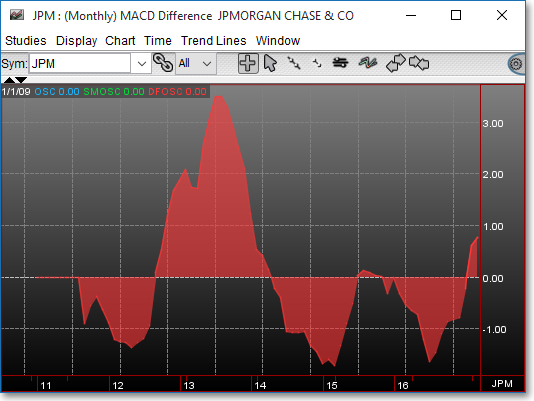
Chart Settings
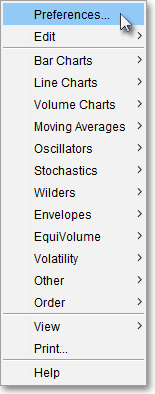
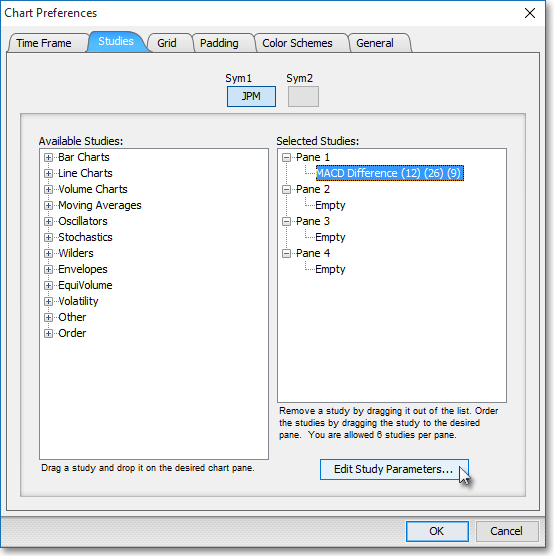
Once the MACD technical indicator is selected in a Chart window, you may click with the right mouse button in the body of the Chart window and select "Preferences" to access the "Studies" tab. Once there, you may select the study you wish to edit (in this example, "MACD Difference (12) (26) (9)" is selected), and then click "Edit Study Parameters" in order to select the moving average period and price data to be used in the MACD Difference calculation.
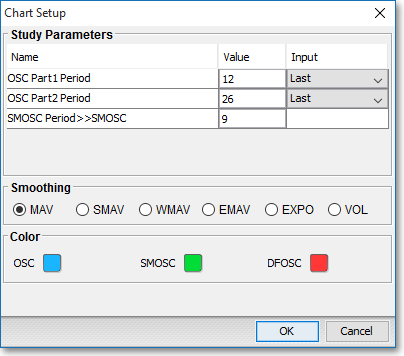
OSC Part1 Period: This parameter lets you define the moving average period (Value) and the type of price information (Input Data) to be used for the first moving average line of the difference calculation.
OSC Part2 Period > > OSC: This parameter lets you define the moving average period (Value) and the type of price information (Input Data) to be used for the second moving average line in the difference calculation. The difference of the first moving average line (OSC Part1) and the second moving average line (OSC Part2) will result in a Difference Oscillator (OSC), which will appear on the chart.
SMOSC Period > > SMOSC: This parameter lets you assign a moving average period (Value) to the first oscillator line (SMOS1).
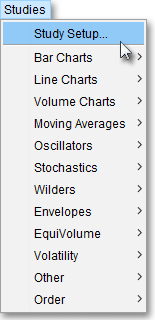
Note: You may also access the "Chart Setup" window by clicking on "Studies" and selecting "Study Setup..." from the drop-down menu.
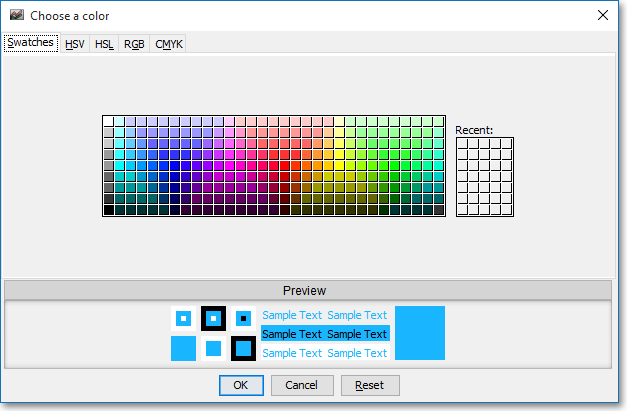
Note: If you wish to change the color of the Chart's lines, simply click on the square to the right of "OSC," "SMOSC," or "DFOSC" respectively to cause the "Choose a Color" box to appear. The "Choose a Color" box contains five tabs: "Swatches," "HSV," "HSL," "RGB," and "CMYK." The "Swatches" tab lets you select one of several color "swatches" to replace the existing component color of the selected color scheme. The "HSV," "HSL," "RGB," and "CMYK" tabs let you edit the color of the selected swatch. If at any time you do not like the color of the swatch you selected or you do not like the color changes you have made to the swatch itself, click Reset to return to the existing component color of the selected color scheme. Once you have selected a replacement color, click OK.
Formulas
MACD Difference = Standard Oscillator
- SMOSC
Where:
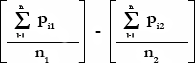
Standard Oscillator:
Where:
Pi1 = Current Price of 1st Moving Average
n1 = Number of Intervals on 1st Moving Average
Pi2 = Current Price of 2nd Moving Average
n2 = Number of Intervals on 2nd Moving Average
SMOSC = Smoothed Version of the Standard Oscillator Line
Signal Line:
*This is the Formula of the recommended
Signal Line:
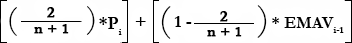
Where:
n = Number of Intervals
Pi = Current Price
EMAVi = Current EMAV Value